How to Use OpenTelemetry for Observability in Java
A getting-started guide for those looking to improve reliability and performance of Java applications using developers' go-to framework for collecting and managing telemetry data.
If observability is part of the foundation on which the SRE house is built, then telemetry data—metrics, logs and traces—is the concrete that foundation is made of.
A go-to option for harnessing this data in complex, highly distributed cloud native environments is OpenTelemetry. The CNCF open source observability framework is a robust collection of APIs, libraries, agents and instrumentation for capturing and managing heterogeneous telemetry data.
This guide provides an overview of OpenTelemetry’s basic concepts and components and walks through configuring, implementing and using the framework in Java.
More on observability and OpenTelemetry:
- What’s a Collector and Why Would I Want One?
- Harnessing OpenTelemetry in Golang to Improve Observability
- How to Improve Observability Using OpenTelemetry in Python
- Getting the Most Out of OpenTelemetry Collector
How OpenTelemetry Works
OTel addresses all three essential types of telemetry data: traces, metrics and logs.
Traces
Traces let you track the progression of your system's tasks and operations. Each operation performed along the route of a trace is known as a span (similar to method invocations or HTTP requests). An entire trace (made up of spans) can be compared to an exception's stack trace.
Metrics
Metrics are aggregated statistics of your system's profiled data, such as system resource usage, service call rates or system warning and error rates.
Logs
Like in other software, OpenTelemetry logs contain data produced by processes, services and other components. They may not always include error or warning details, but they can include more benign (but useful) information, for example, the time a service was started.
OpenTelemetry’s primary focus is handling and transmitting data. The framework has language-specific components as well as non language-specific ones.
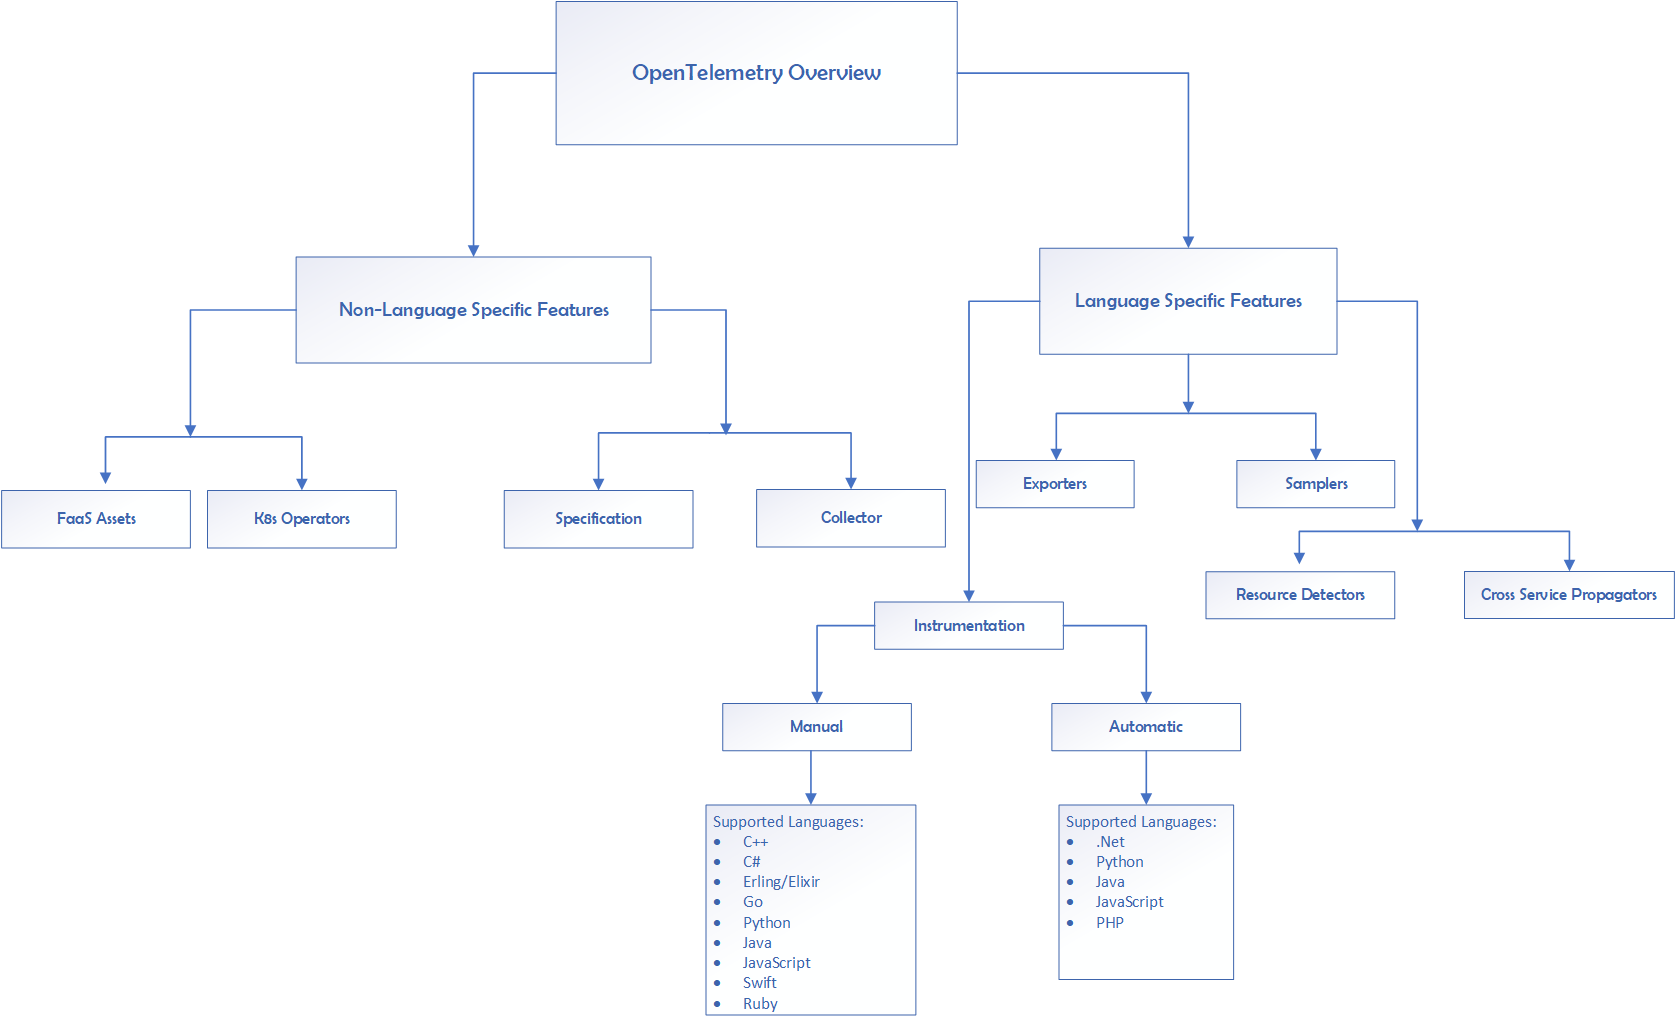
OpenTelemetry Language-Specific Components
OpenTelemetry provides the following language-specific libraries, APIs and SDKs:
- Instrumentation is the process of preparing a system for observability that involves enabling its core coding components to emit trace, metric and log signals. OpenTelemetry offers both automatic and manual instrumentation methods.
- Exporters act as channels for sending or broadcasting data. Each exporter connects to an endpoint, either an OpenTelemetry Collector or third-party backends, such as Jaeger and Zipkin. You can find the complete list of compatible exporters in the OpenTelemetry Registry.
- Resource Detectors offer an alternative way to extract telemetry, without exporters. You can use the Resource SDK to access and implement OpenTelemetry's resource functionality.
- Cross-service Propagators allow you to transmit telemetry (mainly traces) between processes and services. This is mainly used for distributed systems separated by boundaries. While you can propagate traces using instrumentation libraries, you can also do so using Context and Propagators API.
- Samplers let you record memory states and thread dumps with reduced overhead, ensuring more consistent timing for signal recording. OpenTelemetry offers a large variety of head-based samplers, including Java API's Jaeger Sampler.
OpenTelemetry Non Language-Specific Components
OpenTelemetry non language-specific components refer to APIs, SDKs, libraries and components that can be used alongside any project. They include:
- Specification (aka specs) contains documentation for OpenTelemetry's components, APIs and SDKs and how to implement them.
- Collector offers a vendor-independent solution for exporting, receiving and processing data. By default, your telemetry data is sent to a collector, which can be one of OpenTelemetry's default collector agents or a custom backend.
- The OpenTelemetry Operator for Kubernetes is a special implementation of the Kubernetes operator that helps facilitate automatic instrumentation for workloads.
- Function-as-a-service (FaaS) assets refer to platforms that enable the development and execution of cloud-based programs. OpenTelemetry's community assets allow you to instrument and gain observability into the features, functions and applications you develop on FaaS platforms.
Using the OpenTelemetry Java SDK
Because OpenTelemetry is open source, there is source code available for both manual and automatic instrumentation. Here’s a look at how instrumentation and data collection work in Java.
In the following example, you'll use OpenTelemetry's Java SDK, API and exporter logging to collect telemetry from a simple application that connects and fetches data from a remote database.
Configure OpenTelemetry for Your Project
This example mainly focuses on trace and span (io.opentelemetry.trace.Span) building.
First, initialize your project and declare the necessary dependencies. Alternatively, you can add OpenTelemetry to an existing project.
Note that while the configuration and main classes are provided, you need to create your own remoteCaller class with a fetchRecord and/or adapt the code accordingly.
Include the following libraries as project dependencies:
This example uses the opentelemetry-exporter-logging package, which allows you to use OpenTelemetry's official Logger. An extension of the java.util.logging.Logger, it enables you to log data into memory and your console.
Once you're done declaring your dependencies, you need to create a class that defines and configures an extension of the OpenTelemetry SDK and API. Import the following components:
import io.opentelemetry.api.OpenTelemetry; //Allows to create an instance of the OpenTelemetry API
import io.opentelemetry.sdk.OpenTelemetrySdk; //Provides you with builders to create the OpenTelemetry API instance
import io.opentelemetry.sdk.metrics.export.MetricReader; //Allows you to record metric data
import io.opentelemetry.exporter.logging.LoggingMetricExporter; //Allows you to export and log recorded metric data
import io.opentelemetry.exporter.logging.LoggingSpanExporter; //Allows you to export Trace (span) data
import io.opentelemetry.sdk.metrics.SdkMeterProvider;            //Provides you with tools to extract meter telemetry
import io.opentelemetry.sdk.metrics.export.PeriodicMetricReader; //A metric reader that captures data periodically
import io.opentelemetry.sdk.trace.SdkTracerProvider;         //Allows you to build a tracer and export it
import io.opentelemetry.sdk.trace.export.SimpleSpanProcessor; //Allows you to create spans
In addition to these classes, interfaces and packages, you need to import this class:
import java.time.Duration;
Then add a class constant that represents the intervals between metric recordings:
private static final long METRIC_EXPORT_INTERVAL_MS = 800L;
This instructs OpenTelemetry to record metric data every 800 milliseconds.
Initialize Your OpenTelemetry Configuration
Now, you need to initialize your OpenTelemetry configuration. This is where you specify how your traces, metrics and logs should be collected. The method should return the OpenTelemetry API as an object:
public OpenTelemetry initializeOpenTel() {

     //Defines and builds a Tracerprovider
        SdkTracerProvider sdkTracerProvider = SdkTracerProvider.builder()
                .addSpanProcessor(SimpleSpanProcessor.create(LoggingSpanExporter.create()))
                .build();

        MetricReader periodicReader =
                PeriodicMetricReader.builder(LoggingMetricExporter.create())
                        .setInterval(Duration.ofMillis(METRIC_EXPORT_INTERVAL_MS))
                        .build();

        SdkMeterProvider sdkMeterProvider =
                SdkMeterProvider.builder().registerMetricReader(periodicReader).build();

        OpenTelemetry openTelemetry = OpenTelemetrySdk.builder()
                .setTracerProvider(sdkTracerProvider)
                .setMeterProvider(sdkMeterProvider)
                .buildAndRegisterGlobal();

        return openTelemetry;
    }
The `SDKTracerProvider` collects and processes the project's spans using a `SimpleSpanProcessor`. Span data is logged by the `LoggingSpanExporter`, whereas the `LoggingMetricExporter` is responsible for metric data collected and aggregated by the `MetricReader`.
The previously created METRIC_EXPORT_INTERVAL_MS constant is used to specify how often metric data should be captured, and the periodicReader is registered (register()) to an implementation of the `SDKMeterProvider`.
(You may notice that there isn't a separate implementation of OpenTelemetry's Logger features SdkLoggerProvider, which would be superfluous. But it's important to keep in mind that this class exists if you have a custom or established backend and a distributed system with log-generating components.)
The trace, metrics and log SDK implementations act as attributes for the OpenTelemetry implementation. This means that in addition to building the OpenTelemetry SDK object, you set its Tracer (SDKTracerProvider) and Meter (SDKMeterProvider) providers and then build and register it as global (usable across your project).
The completed OpenTelemetry configuration file should look like this GitHub file.
Implement OpenTelemetry
With OpenTelemetry SDK configured for your project, it’s time to implement the functionality:
//Begin OpenTelemetry Imports
import io.opentelemetry.api.OpenTelemetry;
import io.opentelemetry.api.metrics.LongCounter;
import io.opentelemetry.api.trace.Span;
import io.opentelemetry.api.trace.Tracer;
//End OpenTelemetry Imports

//Begin SQL imports
import java.sql.ResultSet;
import java.sql.SQLException;
//End SQL imports

public class Main {

    final static String INSTRUMENTATION_NAME = "Remote-DB-Connector";

    public static void main(String [] args) {
        OpenTelemetry openTelemetry = new OTelConfiguration().initializeOpenTel();

        Tracer tracer =
                openTelemetry.getTracer(INSTRUMENTATION_NAME);
        LongCounter counter = openTelemetry.getMeter(INSTRUMENTATION_NAME).counterBuilder("work_done").build();

        //RemoteCaller class performing remote database actions
        RemoteCaller remoteCaller = new RemoteCaller();

        Span fetchRecordSpan = tracer.spanBuilder("Fetch and process records").startSpan();
        Span iterateSpan;
        try {
            ResultSet resultSet = remoteCaller.fetchRecords();
            iterateSpan = tracer.spanBuilder("Iterate Through Record").startSpan();
            while (resultSet.next()) {
                //Perform Actions
                counter.add(1);
            }
            iterateSpan.end();

        } catch (SQLException sqlException) {
            throw new RuntimeException(sqlException);
        } finally {
            fetchRecordSpan.end();
        }

        try {
            // Flush out the metrics that may have not yet been exported
            Thread.sleep(1000L);
        } catch (InterruptedException e) {
            // ignore since we're exiting
        }
    }
}
Give the instrumentation a name, so it's easier to find from your log screen (INSTRUMENTATION_NAME), and initialize your implementation of SDK.
The code is instructed to fetch a `Tracer` and `LongCounter` from the OpenTelemetry SDK, the latter being used to gather your metric data.
The RemoteCaller class connects to a remote PostgreSQL database. It contains a single method (fetchRecords()) that fetches all the records from a specified table. This action makes up a single span for your tracer. You can learn more about creating spans from the Traces section of the Java OpenTelemetry Getting Started guide.
The first span is dedicated to fetching the records (fetchRecordSpan). You have to use the `io.opentelemetry.api.trace.Tracer` interface's SpanBuilder(String spanName) method to create the span. It returns an implementation of the SpanBuilder interface with your span's name as its main attribute. Your span name should be concise but detailed enough to describe the operation it's tracking.
In addition to enabling you to name your span, the SpanBuilder gives you access to a set of attributes that allow you to create nested spans, spans with timestamps and spans with custom attributes. With these features you can extract additional information from traces. (We use a single attribute in this example to keep it simple.)
The startSpan() method returns a span object. The next line then defines but does not initiate another span object (iterateSpan), which is used as a nested span. The try, catch and finally statements are used to create a nameless scope for the spans.
Note that the code is using a named scope (try (Scope ss = span.makeCurrent()) {}) because it uses a nested span.
The remoteCaller's fetchRecords() method is called as the first operation in the try block. It returns a ResultSet.
Next, the code initiates the iterateSpan object and then loops through the result set (resultSet). The LongCounter (counter) tracks how many times the result set is iterated without interruption. This serves as the metric data. The iterateSpan ends (iterateSpan.end()) when the whole operation completes all loops.
The finally block is used to end the fetchRecordSpan. Notice how fetchRecordSpan encompasses the entire process (scope), including the iteration process, while iterateSpan exclusively covers the result-set iteration process.
Since OpenTelemetry is configured to fetch metric data every few milliseconds, there could be a lag in exporting this metric data. The `Thread.sleep()` function ensures the application doesn't terminate abruptly.
Analyze the Results
Once you've run the application successfully, OpenTelemetry should log the results onto your console using the Java Logger:
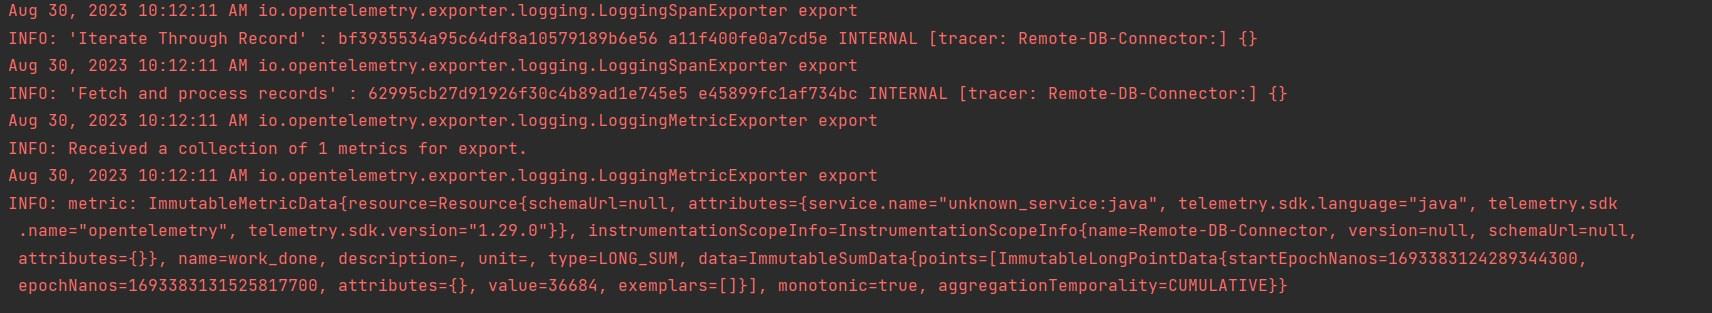
Each portion of telemetry data can be identified by its own export. Since you have two spans, you'll see two calls to the LoggingSpanExporter. Notice that the results tell you when the spans completed their operations and are exported upon completion. This means the first export is the iterateSpan span method.
The next set of information relates to your metric data, which was exported using the LoggingMetricExporter's export method. First, it informs you of the number or sets of metric data available for exportation (...1 metrics for export). This can be viewed as metadata. The second export gives you the contents of the collected metric data.
The instrumentationScopeInfo contains your instrumentation name, while the type field contains the type of metric data you chose to collect. Since you used the LongCounter, your type will be LONG_SUM. The value field reflects the number of times the RemoteCaller's result set was looped through.
You can ascertain at what time the metric data was collected by referring to the beginning and ending timestamps, which are captured in Epoch nanoseconds.
You'll also notice numerous attributes fields. These are used to carry annotation-based information, such as context and baggage.
The monotonic and aggregationTemporality are intrinsic data point properties. You can learn more about them from the OpenTelemetry Protocol Data model.
Best Practices for Leveraging OpenTelemetry in Java
Because OpenTelemetry is a growing project, you're bound to bump up against a few challenges along your integration journey. Here are a few tips and tricks to minimize those:
Be Mindful of OpenTelemetry Versioning
Even though finding the latest documentation (especially Javadocs) can be a little tricky at first, always make sure that you're using docs that correspond to the version of OpenTelemetry API, SDK and exporters that you're using for your project.
Additionally, some OpenTelemetry components are still beta or experimental/alpha, while others may be fresh out of the beta phase. Always check to make sure you're using the latest libraries.
Establish Structure
One of OpenTelemetry's biggest pitfalls is that it can appear very open ended. Its rules and approaches to telemetry collection through manual instrumentation can feel ill defined. While some may view this flexibility as a blessing, others can get a little lost.
To help make things easier, OpenTelemetry encourages its users to define attributes and establish shared attribute libraries. Attributes allow you to annotate your data further, making it easier to analyze.
Shared attribute libraries work like a collection of tags that only your company or group of developers uses. Developers are only allowed to use attributes from this shared library, and new attributes can only be added when absolutely necessary. This makes working with OpenTelemetry a little more structured.
To make code annotation and building shared attribute libraries easier, OpenTelemetry introduced Semantic Conventions. These let you enforce naming standards for various operation types. For Java, this is implemented through the SemanticConv library (in alpha at the time of publishing).
Prioritize What Data You Collect
You should also consider the cardinality or the importance/uniqueness of your data. High-cardinality data refers to rare or nonrepeating data. This data is commonly used to identify anomalies and should be used for fine-grained analysis. In comparison, low-cardinality data should be aggregated and used for metrics.
It's also recommended that you prioritize service levels over events. Track data according to its potential user impact. In other words, gather contextual information surrounding certain events.
Conclusion
In this guide, you explored OpenTelemetry and how it can be used for observability in your Java applications. This can aid you in troubleshooting or maintaining service delivery for your applications.
Hopefully, besides encouraging you to implement OpenTelemetry, it also encourages your participation in its development. OpenTelemetry has a large community following, and support is always welcomed and appreciated.
If you do decide to integrate OpenTelemetry into your own ecosystem, its specifications are an important part of the project, and I recommend reading through them. Finally, check out the examples in this GitHub repo to learn even more about OpenTelemetry.

Ready to kick the tires?
Use code DEPLOYNOW for $300 credit