Getting the Most Out of OpenTelemetry Collector
The OTel collector is an essential element of observability in cloud native environments. Here’s what to know in order to get it right.

Keeping a distributed system smoothly chugging along requires an effective, methodical approach to observing its behavior. These systems, often consisting of numerous different microservices, emit a lot of useful telemetry data, including metrics, logs and traces. Managing this data effectively is crucial for maintaining performance, quickly diagnosing and resolving issues and understanding user behavior.
Because distributed systems tend to run on a variety of platforms, such as Kubernetes or Amazon Web Services (AWS) Lambda, they generate a variety of signals that are unique to each platform. Detecting whatever platform-specific issues that may arise during request processing requires correlating these platform-specific signals with the application.
Instrumenting your application and platform with a single vendor's observability library may impede your application’s portability across cloud providers or on-premises infrastructure. OpenTelemetry, a CNCF open source observability framework, addresses this problem with APIs, libraries, agents and instrumentation for capturing and managing heterogeneous telemetry data.
The OpenTelemetry components are structured in a pipeline format:
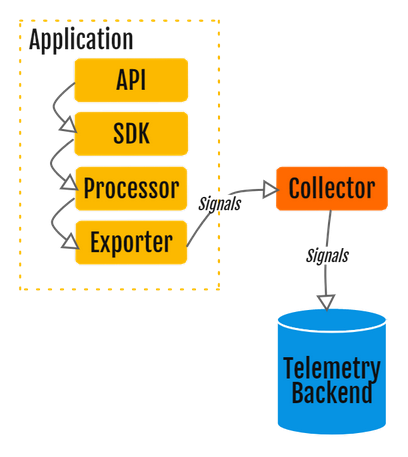
In this article, you'll learn all about the OpenTelemetry Collector (OTel Collector), a centralized and vendor-agnostic solution for telemetry data management. You'll learn how to use the OTel Collector to streamline data gathering and processing, as well as some best practices for implementation.
How we've used OpenTelemetry and the collector at Equinix:
- What’s a Collector and Why Would I Want One?
- OpenTelemetry and the Ghost of Provisioning Past
- Leveraging OpenTelemetry Tracing to Tune Our Rails Monolith
Deep Dive into the OpenTelemetry Collector
The OTel Collector is a vendor-agnostic service that can receive, process and export telemetry data. It's designed to be deployed as an agent on a host or as a stand-alone service, and it supports receiving and exporting telemetry in open source observability data formats, including OpenTelemetry Protocol (OTLP), Jaeger and Zipkin.
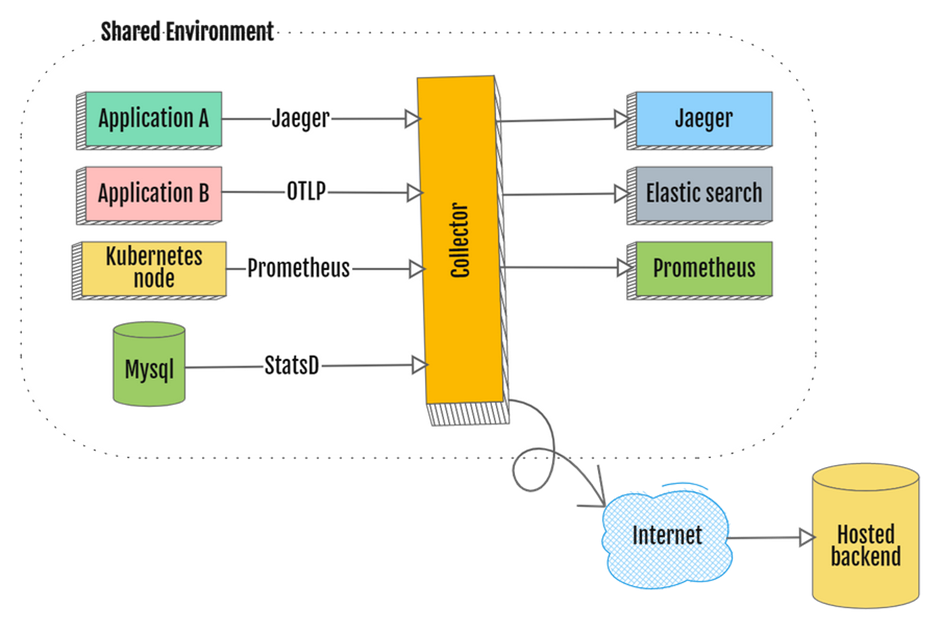
The collector is a crucial component within the OpenTelemetry framework, bridging multiple telemetry producers and the appropriate backends. A user easily sends their data to the collector, which then processes and exports it to their telemetry backend.
Here’s an illustration of a collector deployment in an environment containing multiple telemetry sources:
OpenTelemetry Collector components can be arranged in a pipeline like this:
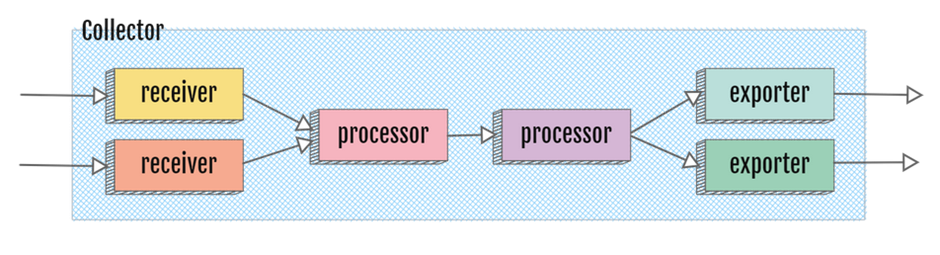
This pipeline consists of three core elements:
- Receivers ingest data in any of the various supported formats and convert it to the OTLP format.
- Processors perform auxiliary operations, such as filtering unwanted telemetry or adding more attributes to data before sending it to the exporter.
- Exporters, which are a component of the collector, perform a task similar to that of exporters in the OpenTelemetry SDK, taking data in the OTLP format, marshaling it into the output format and sending it to one or more specified destinations.
The collector also supports extensions. They don't have access to telemetry data and are not included in the signal processing pipeline. A few examples are health monitoring, service discovery and data monitoring.
Before setting up the collector components, you must identify the pieces that will make up your OpenTelemetry pipeline. This can be done by creating a configuration in the YAML format and indicating which elements will be configured in the collector through the service section like this:
receivers:
  otlp:
protocols:
   grpc:
   http:
processors:
  batch:
exporters:
  otlp:
endpoint: otelcol:4317
extensions:
  health_check:
  pprof:
  zpages:
service:
  extensions: [health_check, pprof, zpages]
  pipelines:
traces:
   receivers: [otlp]
      processors: [batch]
   exporters: [otlp]
metrics:
   receivers: [otlp]
      processors: [batch]
   exporters: [otlp]
logs:
   receivers: [otlp]
      processors: [batch]
   exporters: [otlp]
With this specification you can create an OpenTelemetry pipeline to receive telemetry signals in the OTLP format, including traces, metrics and logs. The batch processor allows the collector to group telemetry signals together before exporting them. Finally, the OTLP exporter sends the telemetry through the OTLP endpoint.
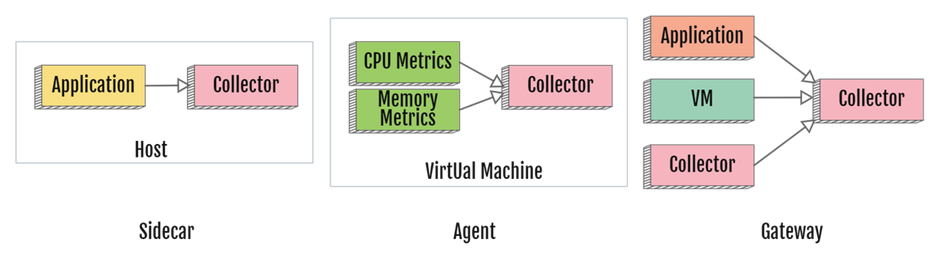
Some OTel Collector use cases are closely related to its deployment models and include the following:
- Collector as a sidecar to collect application telemetry
- Collector as an agent to collect system-level telemetry
- Collector as a gateway
Let’s take a look at them in a little more detail.
Collector as a Sidecar
Sidecars are supporting processes that share the same lifecycle as the primary application. As they're deployed alongside the application on the same host, they are interconnected and share all the resources, such as network and memory. On Kubernetes, the sidecars are deployed in the same pod as the application.
Collector as an Agent
By using a collector as an agent, you can preprocess telemetry data by batching and filtering it. This reduces the amount of data being sent to the telemetry backend and decreases the performance impact on either the application or the telemetry backend.
You can install the collector on every host or node in your environment to do the following:
- Collect metrics about the system it's running on
- Combine metrics of all the applications running on that host or node
- Minimize the number of connections to the backend needed when applications don't use the collector and send telemetry straight to the backend
Collector as a Gateway
Collectors can also be deployed as stand-alone services, also known as gateways. This deployment model offers the following benefits:
- You can scale the collector if your workload increases.
- You can manage configuration, sampling and scrubbing of telemetry centrally.
- Limiting communication with the backend network to the collector service only minimizes breach potential.
OpenTelemetry Collector Best Practices
Following best practices for deploying and operating the OTel Collector can ensure optimal performance and reliability. The following practices cover different aspects of the collector lifecycle, such as setup, scalability and resource management, security, testing and error handling.
Setup and Configuration
When setting up and configuring the OTel Collector, it's important to get the following three things right:
Validate the YAML Configuration File
The YAML configuration file is the core of the collector's setup. It's where you specify the receivers, processors, exporters and extensions. Think of this file as the blueprint for the collector's operation.
Always validate your configuration file before deploying the collector. The OpenTelemetry Configuration repository on GitHub has the JSON schema definition for OpenTelemetry file configuration, which can be used to validate the configuration file’s structure.
Set Up Your Pipeline Configuration
Ensure that your pipeline configuration for each telemetry signal is correctly configured by dispatching simulated telemetry data through the collector pipeline consisting of receivers, processors and exporters. This can help prevent data loss due to misconfiguration in production environments.
Use Environmental Variables
Consider using environment variables in your configuration file for sensitive or configurable data (such as the telemetry endpoint). This enhances security and makes it easier to manage your configuration across different environments. Use ${env:ENV_VAR_NAME} to read a parameter value from an environment variable.
Scalability and Resource Management
Efficient operation of the collector requires careful attention to scalability and resource management. Here are a few useful tips:
Scale the Collector
The collector is designed to be scaled horizontally. As your data volume grows, you can add more collector instances to handle the increased load. However, the process of scaling it depends on whether or not state information is saved in the collector.
The OpenTelemetry Collector scaling guide is a useful resource for learning how to scale the collector.
Monitor Resource Usage
Monitor the resource usage (CPU, memory, network I/O) of your collector instances. If usage is consistently high, consider adding more instances or increasing the amount of resources available to each instance.
Use queue_size
Use the queue_size exporter configuration to control the maximum number of spans that can be queued for each exporter. This can help manage memory usage, especially in high-throughput scenarios.
Security
When deploying the OTel Collector, it's crucial to prioritize security, as the telemetry could potentially reveal important internal system information to unintended parties. Here are some best practices for enhancing security in this context:
Use Transport Security
Secure communication between your applications and the collector using Transport Layer Security (TLS), OpenID Connect (OIDC-Auth) or other authentication protocols. For more information on the configuration setup, please refer to this OpenTelemetry guide.
Run Instances With as Few Privileges as Possible
Running your collector instances with the least privileges necessary can help minimize the impact of a security breach. The OpenTelemetry security guide has instructions for setting that up.
Update Your Collector Instances
Regularly update your collector instances to the latest version to apply the latest security patches and improvements.
Testing and Errors
Ensuring the collector’s reliability requires thorough testing and error handling. Here are some helpful recommendations:
Use the health_check Extension
The health_check extension is useful for monitoring the collector’s health. This can help you quickly identify and resolve issues impacting data collection or export.
Enable the /metrics Endpoint
To keep track of collector metrics and get prompt error notifications, enable the /metrics endpoint of the collector by including the following setting in the configuration file:
service:
  telemetry:
metrics:
   level: detailed
Troubleshoot With the logging Exporter
If you're experiencing issues with the exporter, you can troubleshoot them by adding a logging exporter to your collector pipeline. This exporter prints telemetry data to the console, which can confirm that the collector successfully sent data to the exporters:
exporters:
  logging:
  otlp:
endpoint: <endpoint url>
Test Your Collector in a Controlled Environment
Test your configuration by deploying the collector setup in a test environment before deploying it in production. This can help identify and resolve issues that may not be apparent in a development or testing environment.
Common Pitfalls When Using the OTel Collector
The OTel Collector is a robust solution for handling telemetry data, but it's susceptible to common errors, including misconfiguration and resource management problems. It's important to be aware of them:
Misconfiguration
Misconfiguration of the collector can lead to data loss or incorrect data processing. Here are some common mistakes to avoid:
- Always validate your configuration before deploying the collector. This helps catch errors that may lead to data loss or other issues.
- Be careful when configuring receivers, processors and exporters. Incorrect settings can cause the collector to behave unexpectedly or fail to process data correctly.
- Ensure that your configuration matches the needs of your system. For example, if you're using a specific telemetry backend, make sure you've configured the appropriate exporter.
Resource Management
The collector can consume a significant amount of CPU and memory, especially when processing large volumes of data. Here are some tips to avoid resource management issues:
- Monitor your resource usage regularly. If you notice consistently high CPU or memory usage, consider scaling up your collector instances or increasing the resources available to them.
- Be mindful of the
queue_sizesetting in your configuration. If it's set too high, you could end up consuming more memory than necessary. If it's set too low, you could lose data.
Security
Another area where errors can occur is security. Here are some common security-related pitfalls to avoid:
- Always secure the communication between your applications and the collector. Failure to do so could expose your telemetry data to attackers.
- Run your collector instances with the least privileges necessary to minimize damage in the event of a security breach. The OpenTelemetry security guide lists the necessary steps for improving the security posture of the collector.
- Regularly update your collector instances to the latest version to protect it from known security issues.
Being aware of these common pitfalls and taking steps to avoid them will help you use the OpenTelemetry Collector more effectively and efficiently.
Conclusion
The OpenTelemetry Collector is an essential part of the OpenTelemetry framework. It acts as a powerful and flexible tool for handling telemetry data in distributed systems.
By serving as an intermediary between telemetry producers and backends, the collector is capable of supporting a wide range of scenarios. DevOps and SRE professionals can take advantage of its extensibility and scalability to improve observability and performance. This, in turn, provides valuable insights into system operations that help with performance optimization, faster issue resolution and user experience improvements.
However, it's important to be aware of the challenges in using the OTel Collector effectively, including misconfiguration, resource management problems and security vulnerabilities. Additionally, since the OpenTelemetry Collector is an evolving project with ongoing improvements and additions, it's essential to stay updated with the latest developments.
For more in-depth reading, tutorials and documentation on the OTel Collector, please refer to the OpenTelemetry website and the OpenTelemetry GitHub repository.

Ready to kick the tires?
Use code DEPLOYNOW for $300 credit