OpenTelemetry and the Ghost of Provisioning Past
How, after a year of struggle, it took a better understanding of context—and taking a solid break—to start seeing things clearly and finally fix our new distributed tracing capability.

When I joined Equinix Metal as a Principal Engineer in Fall 2020, I was asked to work on observability. I wrote up a proposal to go all-in on OpenTelemetry (OTel) for distributed tracing, shared it around, and started work on it. We knew that getting into OTel before the 1.0 release could be bumpy and resolved to see it through as a team. Little did we know about what entropy had in store for us.
Ghost in the Machine
Shortly after we kicked off the project, our billing team was in need of observability and ran with the tools, fully tracing their systems before I really had my head around how the OpenTelemetry Collector actually worked. Since our central API is built on Ruby on Rails, they added opentelemetry-ruby, turned on a few auto-instrumentations, and wrote a local tracing library.
Soon after that code was deployed, signals went off, and we declared a production incident. It seemed obvious enough: adding OTel method calls to the stack trace had made things go sideways, so rolling the newest thing back was the logical remediation. We turned OTel off to get back to nominal error levels, and thus began a long year of ghost hunting, chasing ephemeral signals in the dark.
More on distributed tracing and OpenTelemetry:
- Leveraging OpenTelemetry Tracing to Tune Our Rails Monolith
- OpenTelemetry: What’s a Collector and Why Would I Want One?
We had a few more false starts, trying different workarounds, staring at logs, and testing new hypotheses. Unfortunately, these steps forward also included a couple late-night pager wakeups. Events wore on the team over time, each incident more frustrating than the last. Each time we thought we had it figured out, we'd end up having to roll back again.
I had no answer in sight and a mission to enable OTel, while the consequences were mounting. How could I track down, identify, and banish emergent behavior that felt spooky at first and now was starting to feel, well, personal? Eventually, we said enough is enough and assembled a cross-functional team to fix as much as we could within a timebox.
- We fixed messaging bugs in our Rails worker code.
- We fixed timing bugs.
- We partitioned our workers to separate each work queue into its own Kubernetes deployment.
We threw everything we could think of (along with the kitchen sink) at the problem and shipped all this out in late November. The metrics looked good—at least we hadn’t made things worse—so we turned OTel on again. Things looked good for a while. We started to relax and return to our other work. But soon—and this had me wondering if there really was a ghost in the machine—error rates started increasing again. Not drastically at first, but by the middle of the month, alerts started firing and it was time to turn OTel off yet again.
The Long Dark Teatime of the Soul
I was devastated. There were only a few working days left in the year and I had planned vacation to extend my time off. I'd been working on this rollout for a year, and now I had to turn it off again, right before the holidays and end-of-year company shutdown. It was the right thing to do for all the people involved.
I started my vacation with these problems still turning in my mind. My peers were thinking about it too. Some were folks who worked the week before shutdown and sent me their findings, knowing I welcomed any clues they turned up. Over direct messages, we started to put the picture together of what was not working: we could “sense” in the data that there was concurrency in the code which wasn't supposed to be there.
One piece of data that kept coming up got stuck in my mind: the Rails worker queue in our stack uses RabbitMQ for messaging in the backend, and I kept seeing a "frame_too_large" error in the logs. The message implied that there were messages over 134 megabytes in size being sent, and this was finally a strong clue. When I looked in Wireshark, there were only a few packets that were even big enough to hit the maximum transmission unit (MTU)! Looking at the code where RabbitMQ produces that message, I saw that it was produced when the packet header was read, and the size parsed out before the data. The errors weren't caused by chonky messages (as I had taken to calling them), but indicated corrupted message headers.
As much as I wanted to keep attacking the problem, I was exhausted from a long year. I resolved to take my rest and enter the new year with renewed cognitive capacity and determination. The work would still be there in January, and I've found that it usually pays to leave complex problems to my dreams for a while.
Staring Into the Abyss
Upon returning from shutdown, I decided to fork one of the Ruby packages we depend on that was known to be unsafe for threading. Before adding synchronization to that code, I started poking around the application source code to figure out access patterns and determine which methods to prioritize for hardening. While doing that, I decided to take a look broadly at thread usage in the code and on a whim ran grep -R thread .. This walked the filesystem opening every file and searching for the word "thread." When found, it printed the filename, line number, and that line of code. I immediately noticed a pattern I hadn't noticed before. There was a Multithreadable module and it was used all over the place in our provisioning code. I opened that code up and found this:
def run_in_threads(*tasks)
  if Rails.env.test? || Rails.env.integration_test?
    tasks.each(&:call) # iterate over the list and call each in order
  else
    tasks.map do |task|
      Thread.new {
        # This is now running concurrently. ActiveRecord creates a new
        # database connection pool and executes the task in a scope
        # with a new pool.
        ApplicationRecord.connection_pool.with_connection(&task)
      }

      # the last value is returned automatically in ruby so that each
      # below is iterating over thread objects from the main thread
    end.each(&:join)
    # loop over threads and wait for them all to complete before
    # continuing in the main thread
  end
end
Which was called like this:
run_in_threads(
  proc { turn_server_power_on },
  proc { enable_switch_ports },
  proc { set_server_boot_device }
)
This code is problematic in two major ways.
- In test environments, it serializes tasks instead of running them in parallel. This means the code has never been properly tested or run in our continuous integration pipeline.
- The only protection it provides for the tasks being run is a database connection pool.
The module documentation implied it was for general use and said nothing about safety. The code felt naive to me, as if it was written by someone who did not understand the implications of what they had done.
Called as displayed, the run_in_threads code would execute the tasks passed to it concurrently, without synchronization. This worked fine most of the time. The order generally doesn't matter when the whole thing takes as long as the longest operation. This is what it looked like:
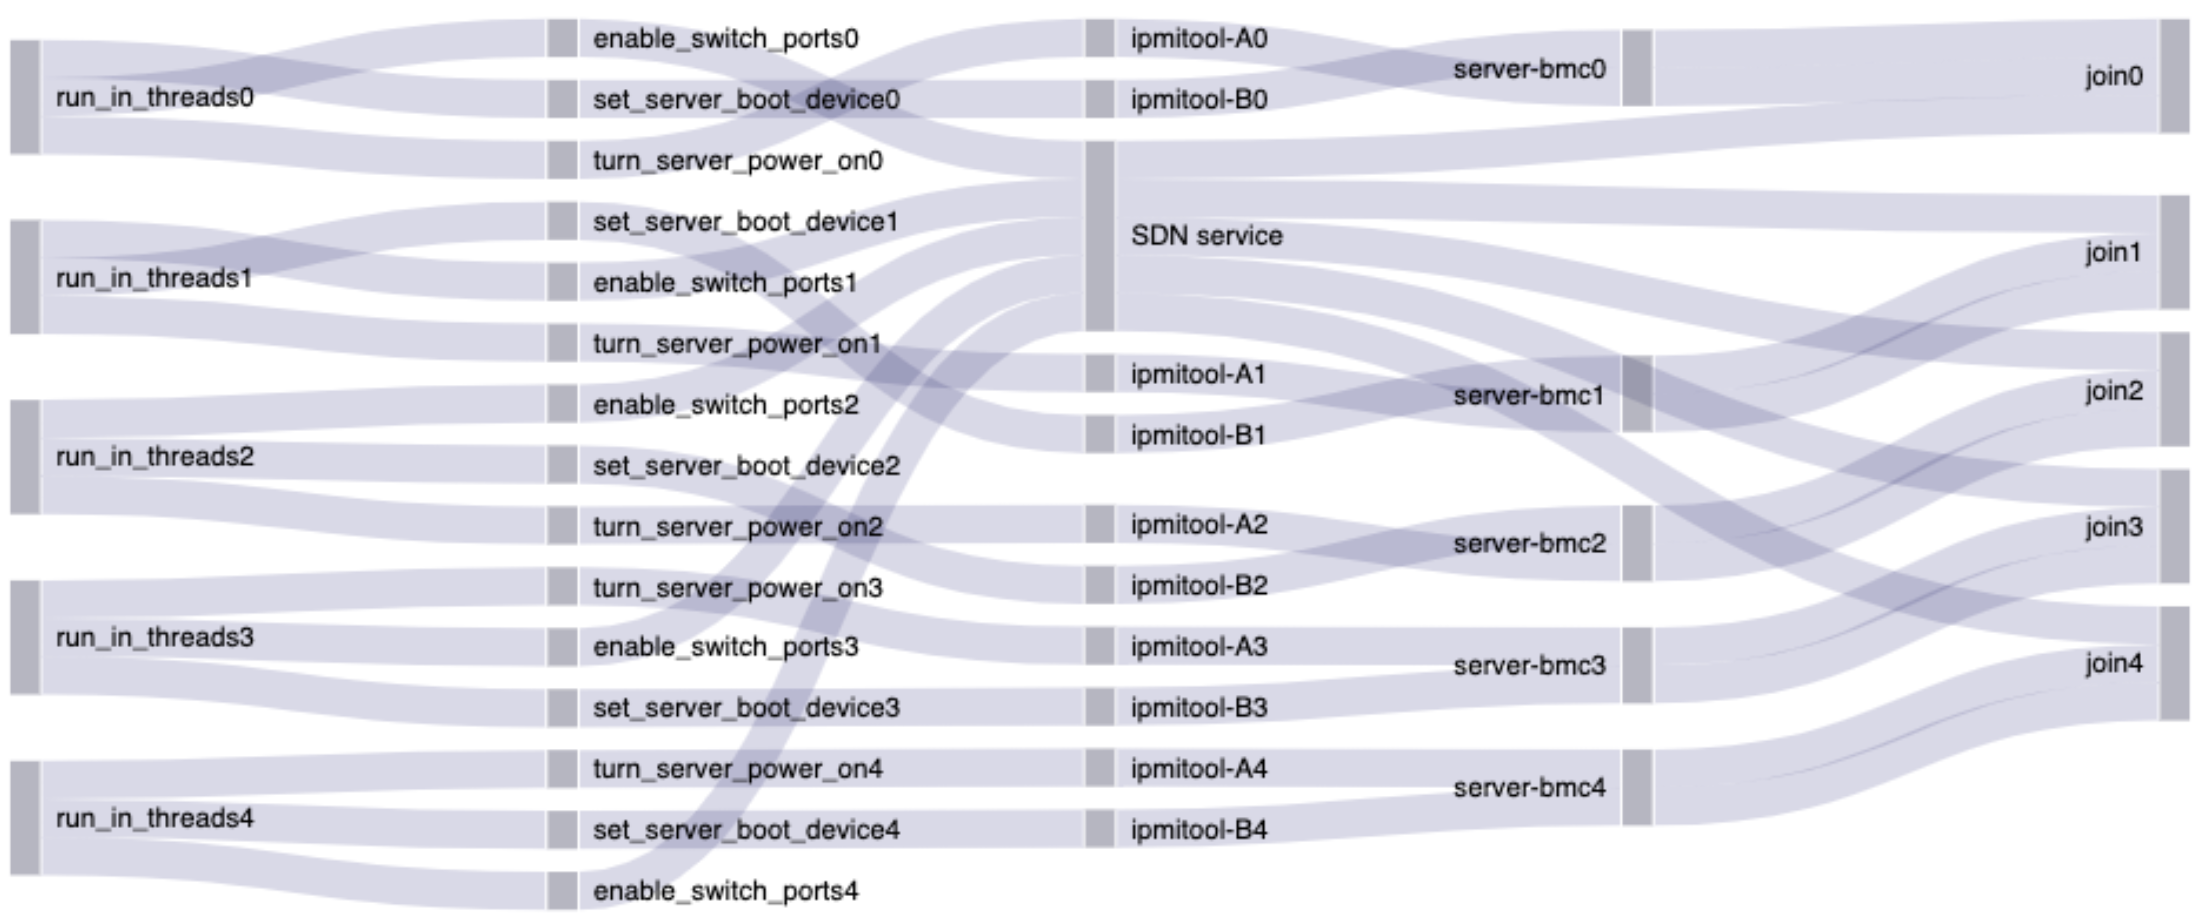
When I turned on OpenTelemetry something like the following would happen. The real situation was even more chaotic than this, so don't feel bad if it doesn't make sense!
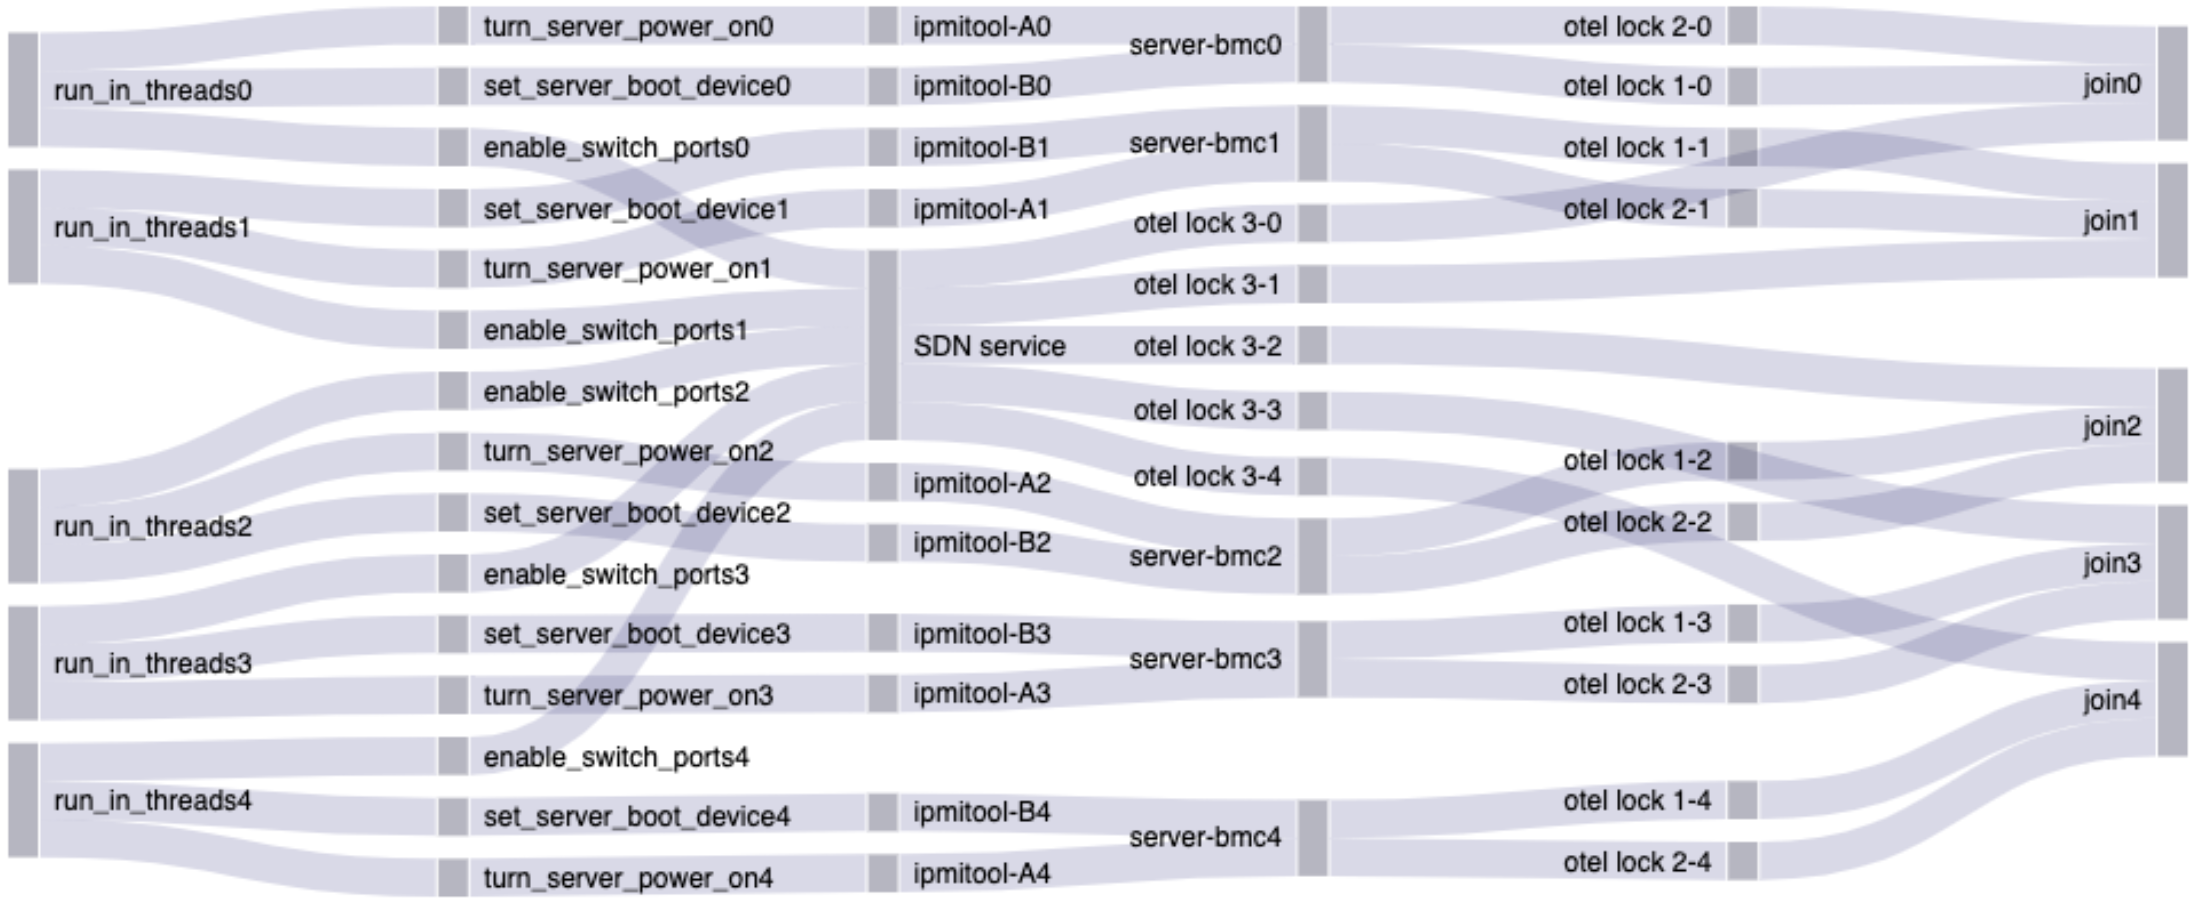
The locks here all appeared harmless, and that remained confusing until I started thinking about side effects. Locks should make the code safer, not break the whole thing, so what's going on here?
The missing piece is thread scheduling.
It was clear because the side effects and elevated error rates did not occur when OTel was in non-recording mode. Every call to create a span or set an attribute still called the methods in opentelemetry-ruby, but internally, the method returned early without locking and without starting the background thread.
Ruby threads are a 1:1 model with operating system threads, so thread scheduling is done by the Linux Kernel. When OTel is in non-recording mode, the methods still get called but do nothing and do not lock, so no problems arise. When OTel is recording, each span needs to be written to the global span queue. This involves a lock and also, when there is contention, a context switch. A context switch is when the Linux Kernel pauses one thread or process and starts another.
Before turning OpenTelemetry on, the short tasks would run through to completion without ever context switching. When we turned OTel on, the order of execution became randomized. Things that had previously fallen into the right order before would start to collide and corrupt data, leading to all the issues I described.
Once I got my head around the race conditions and implications of the Multithreadable module, I decided to remove it entirely from our code. That took about a half day of commits, including removing the usage sites, running tests, rinsing, and repeating. Along the way, I got to know the code better and noticed that some of it was quite old. I continued removing the code, got the tests passing (the module I removed also had no tests of its own), and on an impulse merged at the earliest opportunity.
I Know What You Did Last Decade
While working through the code refactoring and testing, I started digging into the source code history to see how we got here. Using git blame, I easily found the original pull request from 2016. Once I got over my astonishment and quick-fire judgements, some things started to make sense. I didn't know the context of what was going on in 2016, but I could guess a lot. The light testing and lack of code review jumped out at me right away as risk factors. I poked around that piece of vintage code a little more and noticed more things that we'd consider unacceptable today but were totally normal for the time.
Out of curiosity, I asked one of our founders, Zac Smith, about what 2016 was like. As a reward for my effort, I got a few old documents to read and a story that aligned with my suspicions. The developer who wrote the problematic code was a polymath who was learning most of the tech involved as they all raced to get a startup off the ground.
Having been a polymath in over her head with concurrency a few times myself, my suspicions of good intent and expectations were confirmed. Zac also revealed that we had a literal rockstar developer on our hands. This developer built the code that led to the job I have today, and then retired to play rock & roll. I am left with nothing but deep respect.
The End of the Beginning
With my hindsight curiosity sated, it was time to deploy the fixes.
The team and I rolled the code out to production, watching our telemetry for any signs of deviance. Because we were on top of it, we quickly identified a new timing bug. The fix was obvious as soon as we looked at our telemetry. I cut a roll-forward PR in a few minutes and canaried the code shortly after. Since rolling that code out, we have had no new problems with spooky behavior in provisioning and zero corrupted messages. OpenTelemetry is back in action and I get to put this spooky ghost to rest.
We started believing OpenTelemetry was introducing an error. That led us to discover threading bugs that were present for years but improbable enough that the system succeeded anyway. Having discovered normalization of deviance and still having few clues to go on, we decided to make our world a better place, fixing whatever bugs that we could find, and still missed.
The ultimate solution seems to have been taking a break, stepping away from the problem, and resting. This opportunity to dream, rest, and come back refreshed enabled me to see the code plainly, notice the race conditions, and finally form a reliable mental model. Once I had that, fixing the code only took a few hours and now I can go back to putting traces in all the (other) things.
In the final analysis, it would be easy to conclude that there was a root cause and that it was so-called human error. I hope that by this point it's clear how those concepts hold back our ability to learn from these stories, asking us to stop before we find the really interesting answers.

Ready to kick the tires?
Use code DEPLOYNOW for $300 credit