Leveraging OpenTelemetry Tracing to Tune Our Rails Monolith
How a team of engineers set out to get load times down to acceptable levels.

Back in the early days of Packet, long before our evolution to Equinix Metal was even dreamed of, our server fleet was measured in the hundreds and even slow code was relatively fast. However, as we’ve grown from measuring in hundreds of machines to measuring in tens of thousands (and from a handful of individual sites to dozens), performance on our console.equinix.com customer portal degraded significantly. By early 2022, some pages were taking tens of seconds to load. Portal load times were especially bad for large customers with a high number of instances.
Since Equinix Metal internal organizations and projects can contain hundreds of test instances and other debugging data, Metal's own sales and customer success teams felt this pain as well. They escalated their concerns to leadership, who asked a handful of engineers to set aside planned sprint work for a few weeks to get load times down to acceptable levels.
It Wasn't (Entirely) the Portal's Fault
The team realized early on that portal response time was slow largely because backend response time was slow.
While parts of our backend monolith were already in the process of being replaced by new services with a more efficient architecture and data model, we couldn't wait for that migration to complete—the code was still being written. Our teammates and customers were feeling this pain now, so we needed to act.
More on distributed tracing and OpenTelemetry:
- OpenTelemetry and the Ghost of Provisioning Past
- OpenTelemetry: What’s a Collector and Why Would I Want One?
As we discussed possible sources for latency, we were reminded of some known inefficiencies. Engineers around the org had long suspected that some endpoints were generating too many database queries per request, which can add up even if individual queries are fast. One ticket linked to an OpenTelemetry trace with over 23,000 spans for a single request, nearly all of which represented database queries. Here’s a video of us scrolling through the trace at 2x speed.
Warning: We do not recommend watching this video if you're photosensitive, due to frequent white flashes.
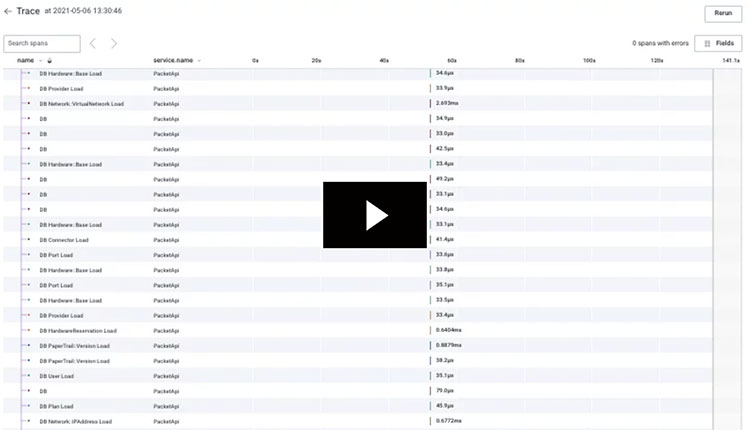
That ginormous trace was our smoking gun. It reeked of N+1 queries, which Rails and other object-relational mapping (ORM) systems are notorious for introducing. Since much of our API monolith code was written long ago, it wasn’t designed to handle tens or hundreds of thousands of servers. Our object model was literally slowing us down!
Our ActiveRecord instrumentation worked beautifully to demonstrate the problem in these huge traces, but it came at a cost. Alas, the explosion in the number of OpenTelemetry spans per request put too much pressure on the service and infrastructure. Faced with other priorities at the time, the team disabled the ActiveRecord instrumentation soon after those giant traces were observed.
Additionally, this 23,000-span example trace wasn't conclusive evidence that N+1 queries were a problem for all of our slow endpoints. In order to debug our performance issues, we needed better observability into the problematic parts of the app.
ActiveRecord Tracing
For readers who are new to tracing, the OpenTelemetry docs provide a good overview of the concepts and benefits.
Our ActiveRecord tracing is custom code that behaves like auto-instrumentation, thanks to the ActiveSupport instrumentation built into Rails. It works by subscribing to ActiveSupport::Notifications for sql.active_record and then generating spans from that data. This is similar to how the Rails integration works in other Rails instrumentation libraries like Honeycomb's Ruby Beeline, NewRelic's Ruby Agent, and OpenTelemetry's ActiveRecord instrumentation, which was added to the Ruby SDK late last year.
Here's what ours looks like:
event = ActiveSupport::Notifications::Event.new(*args)

name = "DB"
name.concat(" #{event.payload[:name]}").strip! if event.payload[:name]

@tracer.start_span(
  name: name,
  kind: OpenTelemetry::Trace::SpanKind::CLIENT,
  start_timestamp: event.time,
  attributes: {
    "db.system" => "postgresql",
    "db.statement" => event.payload[:sql],
    "cached" => event.payload[:cached],
  },
)
The instrumentation code generates a new span for each ActiveRecord event with an attribute for the SQL statement being run, plus it tracks whether or not ActiveRecord hit the Rails query cache for that event.
Here's an example span (represented as JSON) that was generated by this instrumentation:
{
  "Timestamp": "2022-03-29T22:56:19.784382499Z",
  "duration_ms": 0.390804,
  "name": "DB Network::IPAddress Load",
  "db.statement": "SELECT  \"ip_addresses\".* FROM \"ip_addresses\" WHERE \"ip_addresses\".\"deleted_at\" = '0001-01-01 00:00:00 BC' AND \"ip_addresses\".\"deleted_at\" = '0001-01-01 00:00:00 BC' AND \"ip_addresses\".\"id\" = '...' ORDER BY \"ip_addresses\".\"networkable_type\" ASC, \"ip_addresses\".\"networkable_id\" ASC, \"ip_addresses\".\"public\" DESC, \"ip_addresses\".\"address_family\" ASC, \"ip_addresses\".\"management\" DESC, \"ip_addresses\".\"address\" ASC LIMIT 1",
  "db.system": "postgresql",
  "service.name": "PacketApi",
  "trace.parent_id": "43f...",
  "trace.span_id": "c8a...",
  "trace.trace_id": "e1c..."
  ...
}
We may decide to move to OpenTelemetry's ActiveRecord integration now that it's available. It wasn't on our radar when we began this investigation.
Minimizing the Blast Radius
As mentioned above, we disabled the ActiveRecord instrumentation soon after releasing it last year because of the pressure it put on the API service. Enabling it would offer much better observability into the service's behavior, but after a year of OpenTelemetry-related incidents and with ongoing customer pain, we needed to tread lightly.
To minimize any negative impact from our ActiveRecord auto-instrumentation, we wrapped it in a conditional that could be set dynamically via a LaunchDarkly feature flag. This allowed us to enable ActiveRecord tracing only for requests from specific user IDs—namely, the handful of us investigating these performance issues.
def with_active_record_tracing
  # LaunchDarkly requires a user, so only enable ActiveRecord tracing on requests with a user.
  return yield unless current_user && LaunchDarklyClient.instance

  begin
    user_record = { key: current_user.id }
    Trace::ActiveRecordSubscriber.enable(
      LaunchDarklyClient.instance.variation(ACTIVE_RECORD_TRACING_KEY, user_record, false)
    )
    yield
  ensure
    # restore thread-local state
    Trace::ActiveRecordSubscriber.enable(false)
  end
end
While it might not be the ideal use case for feature flags, it allowed us to quickly proceed without taking out the Ruby garbage collector, OpenTelemetry's BatchSpanProcessor, or Honeycomb's ingest API.
LaunchDarkly's requirement for a user ID meant that we couldn't enable ActiveRecord tracing on requests that don't have a logged-in user, like some background jobs. We discussed ways to get around it, but a user-based approach was actually perfect for testing. Long-term we want to get the API service to a place where we can confidently enable ActiveRecord tracing everywhere, but in the meantime the feature flag gives us much-needed guardrails.
Performance Overhead
Even with the small volume of requests from a limited number of users, we wanted to make sure this additional trace data didn't have a significant negative impact on API performance. OpenTelemetry is designed to be safe and performant for production workloads but it never hurts to double check, especially since we were generating thousands of spans per request.
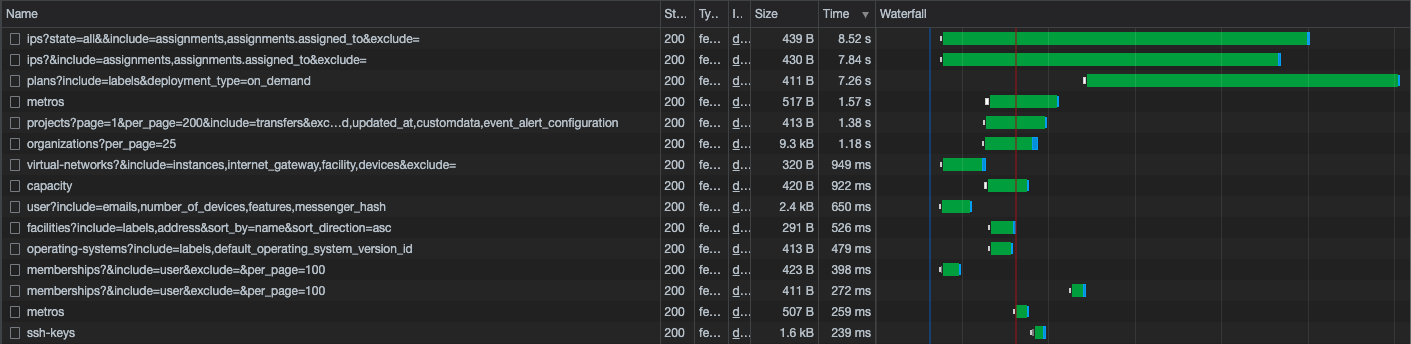
While we didn't have a large sample size, we observed that enabling ActiveRecord tracing didn't meaningfully affect latency for the same requests. The following screenshot shows a list of traces from our early testing, all making the same request to the problematic /ips endpoint. Requests with ActiveRecord tracing enabled (those with thousands of spans) took about the same amount of time as the same requests with it disabled (those with only two spans).
Seeing similar results on the other endpoints was enough for us to feel confident and proceed with our investigation.
Detangling Rails
With ActiveRecord tracing enabled for a handful of team members, we could see how many times the service was querying the database or hitting the cache for individual requests. This level of observability allowed us to quickly confirm that our slowest and most customer-impacting performance issues were caused by excessive database activity.
As mentioned earlier, the N+1 query problem is common in Rails applications, particularly in a scaling scenario like ours. At its core, the issue comes from the ActiveRecord ORM lazy loading individual rows from the database unless explicitly told to prefetch data.
The official Rails recommendation is to cache everything. There is another path, though: with tracing we can see exactly where things happen over the entire lifecycle of each request, turning an intractable problem into a manageable optimization process.
Identifying the Culprit
Looking closely at the traces, it was clear that our database problems were a product of our templating architecture. At Metal we use RABL to define our responses, which are composed by including child templates in objects and collections. For example, this is our template for loading a facility:
object @facility
cache

attributes :id, :name, :code, :features

deleted_at

node(:ip_ranges) { |facility| facility.ip_ranges.map(&:address_with_subnet) }

node(:address) do |facility|
  partial('addresses/show', object: facility.try(:address))
end unless exclude?(:address)

show_only_on_include :labels, as: :labels, template: 'labels/show'

child(metro: :metro) { extends 'metros/show' } unless exclude?(:metro)
Nesting makes it easy to define a response template in one place, but it also means that modifying a template changes the response everywhere that template is used. When combined with the N+1 query problem and the growth in complexity of the Metal API over several years, this design decision had turned into a major engineering problem.
Fixing the Slow Paths
Getting excess database querying out of a years-old Rails monolith is equal parts science and art. In some cases, simply adding includes to a method called in many places was enough to have an impact:
Other situations required a bit more rewriting. A common pattern was code that did a redundant query to look up an object's ID in several places instead of referencing the object directly.
These minimal examples belie the extent of the changes. With such a large amount of code that could be hiding extra queries, we needed a way to test which changes had a measurable impact on performance.
Canarying and Verifying
The N+1 query problem is inherently a scale problem.
In a dev or test environment, it's rare for the volume of data to match what's present in a production environment. Maintaining a parallel environment with a large volume of test data and fake traffic requires significant work and resources, and in the end you're still unlikely to reproduce all of the quirks that inevitably manifest with real users. Even if we had wanted to do that work (and for some orgs it's absolutely worth the effort), it wouldn't have been feasible in a short time. To find out if our code-side optimizations were working, we needed to test in production.
Thankfully, our system already supported canary deploys. The central API service has an api-internal deployment that's not exposed to customer traffic, so any change we make there uses production data but without direct customer impact.
The Process
Canarying provided us with a tight (and very granular) feedback loop for verifying optimizations in the code. The verification process went like this:
- Before canarying, manually cURL a bunch of requests to
api-internalfrom a user account that has the ActiveRecord tracing feature flag enabled - Query Honeycomb for these baseline traces so we have them handy
- Deploy the PR image to api-internal
- Make the same cURL requests again
- Compare the traces before and after canarying
The comparison we did involved choosing exemplars from the baseline and canary traces and then further querying the spans within each exemplar trace. To see how many times ActiveRecord was querying the database or hitting the cache in a request, we looked at the count of ActiveRecord spans in that trace, grouping by the span name (which references the Rails model being looked up) or by the database query statement itself.
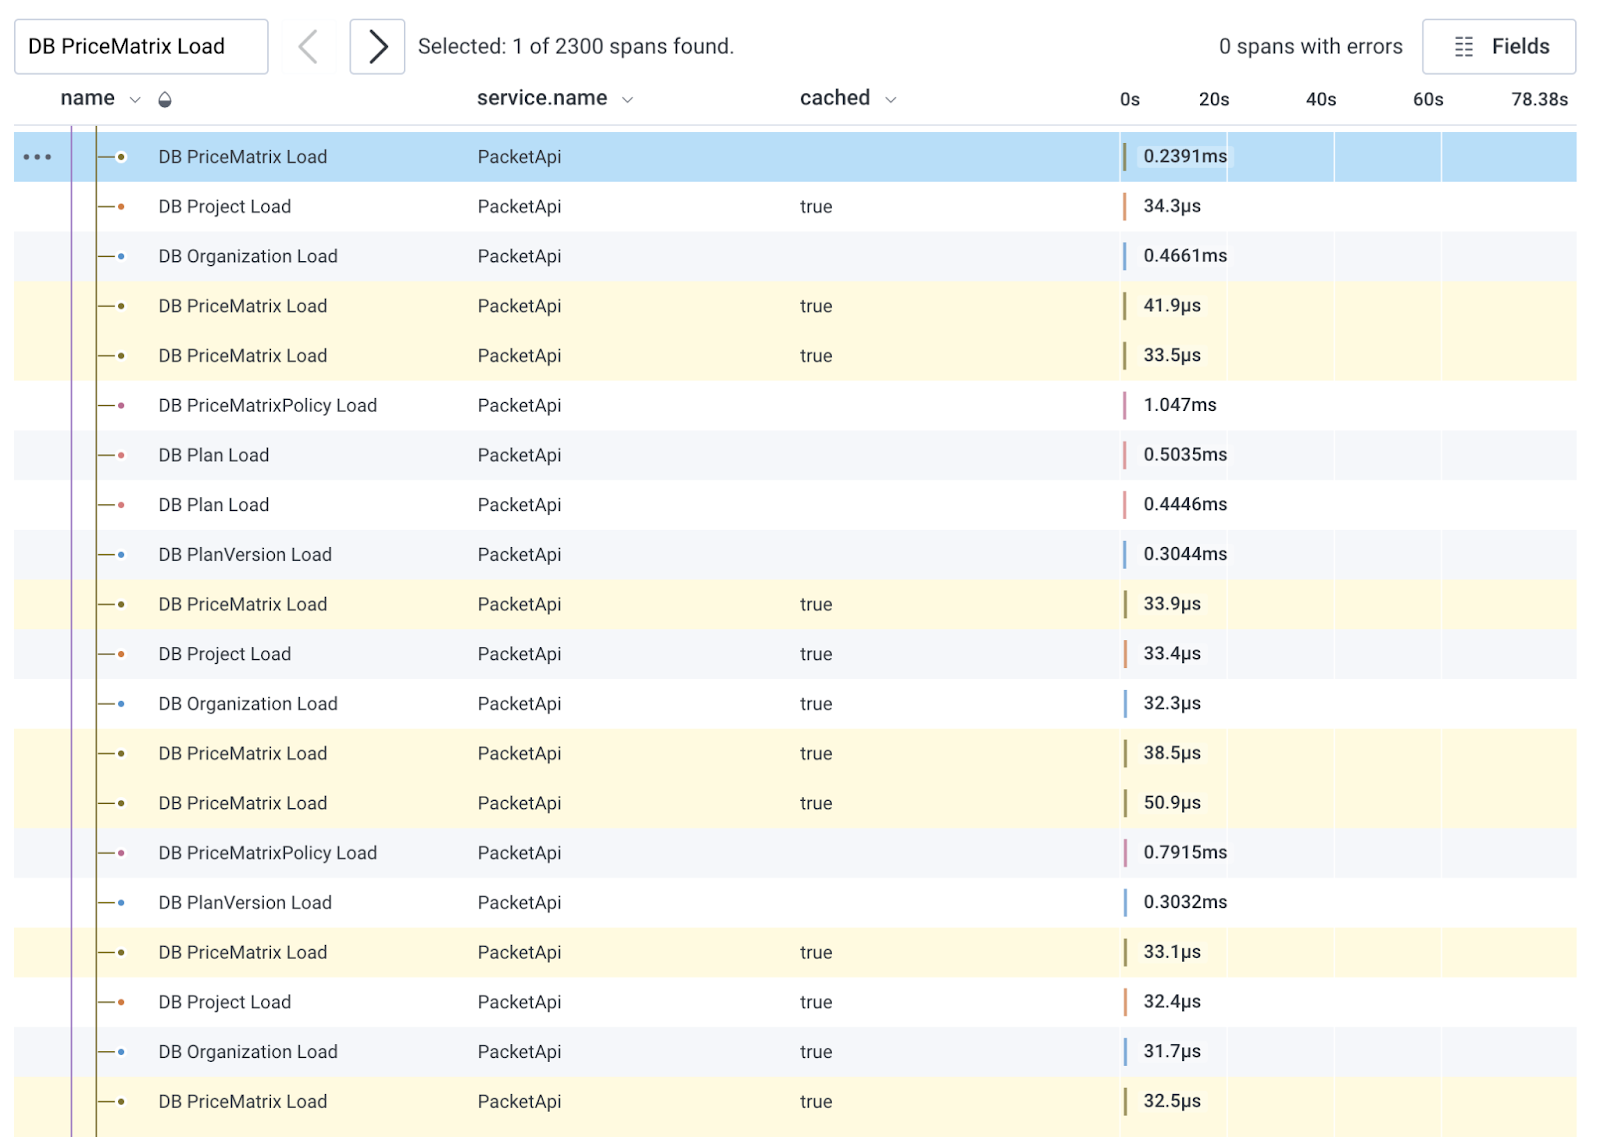
Here's what the data looked like for a request hitting the /ips endpoint, which was probably the worst-performing of the ones we worked on:
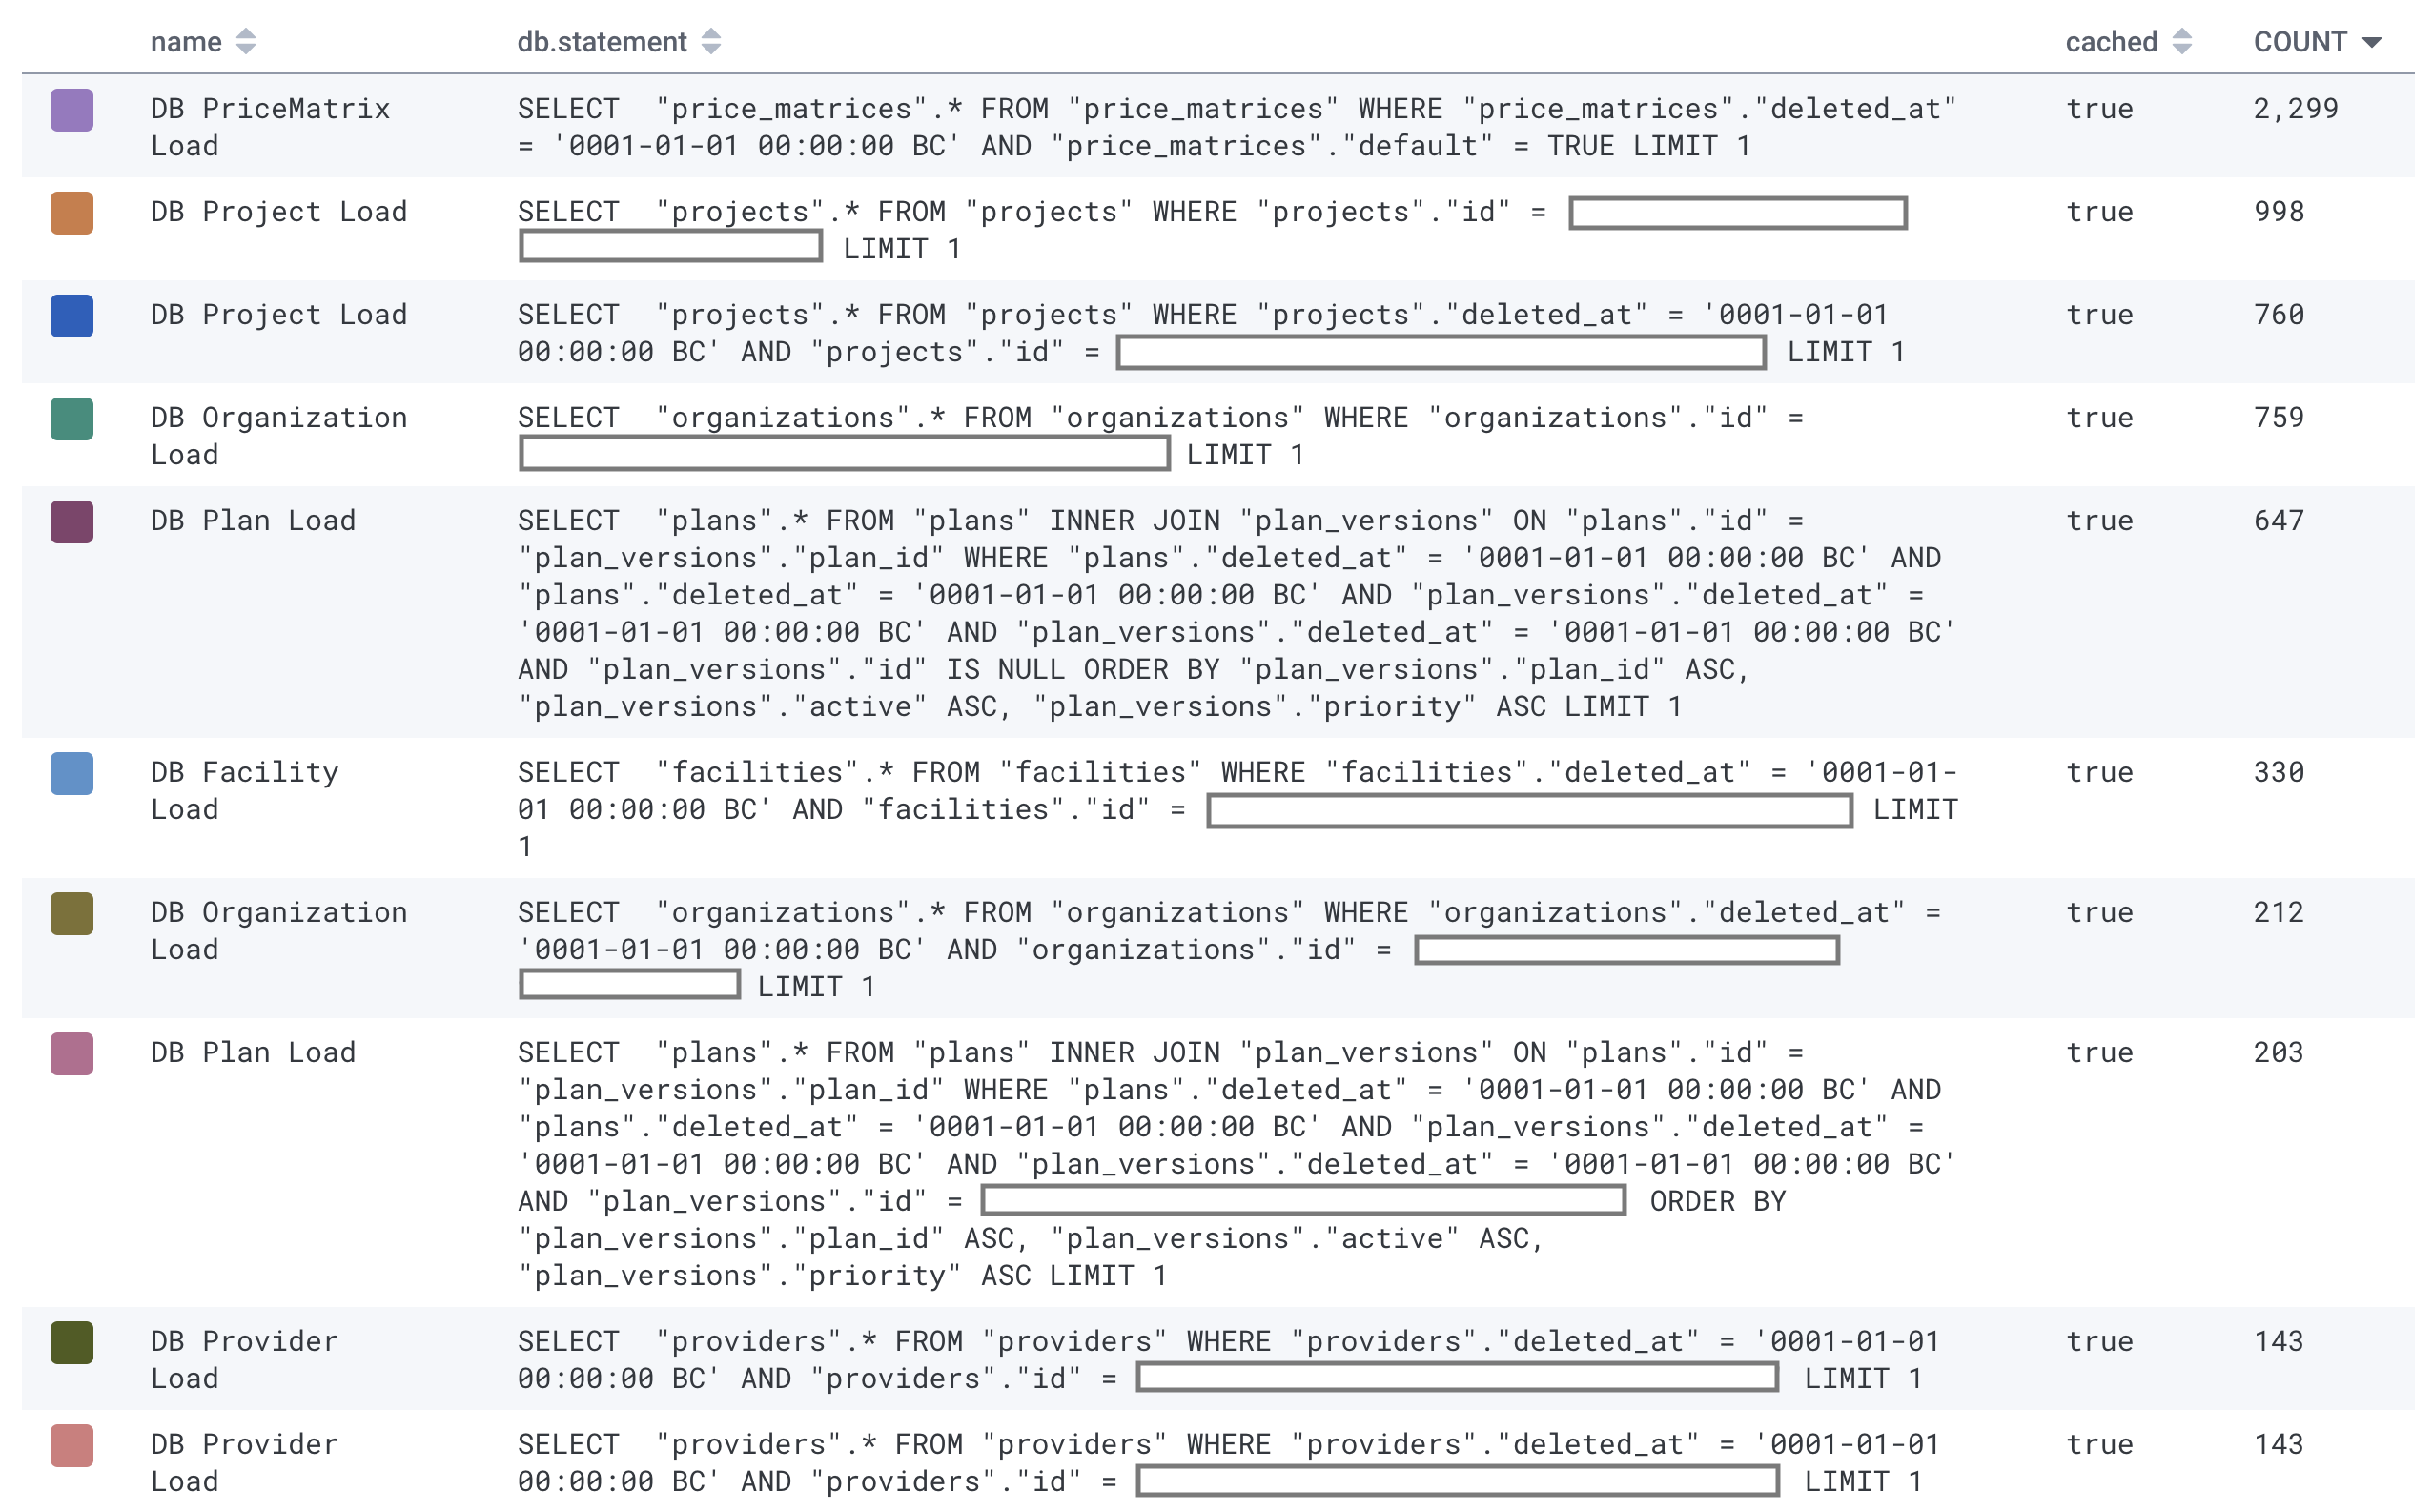
Note that cached is true for all the queries shown above. ActiveRecord's query caching is scoped to the controller action, so in the case of PriceMatrix on this request, it queried the database once and then hit the query cache 2,299 times for those exact same query results:
Query caching alone wasn't enough to maintain fast performance as we scaled. It turns out that doing anything hundreds or thousands of times within one request adds up, even if each one takes microseconds. Go figure!
The Results
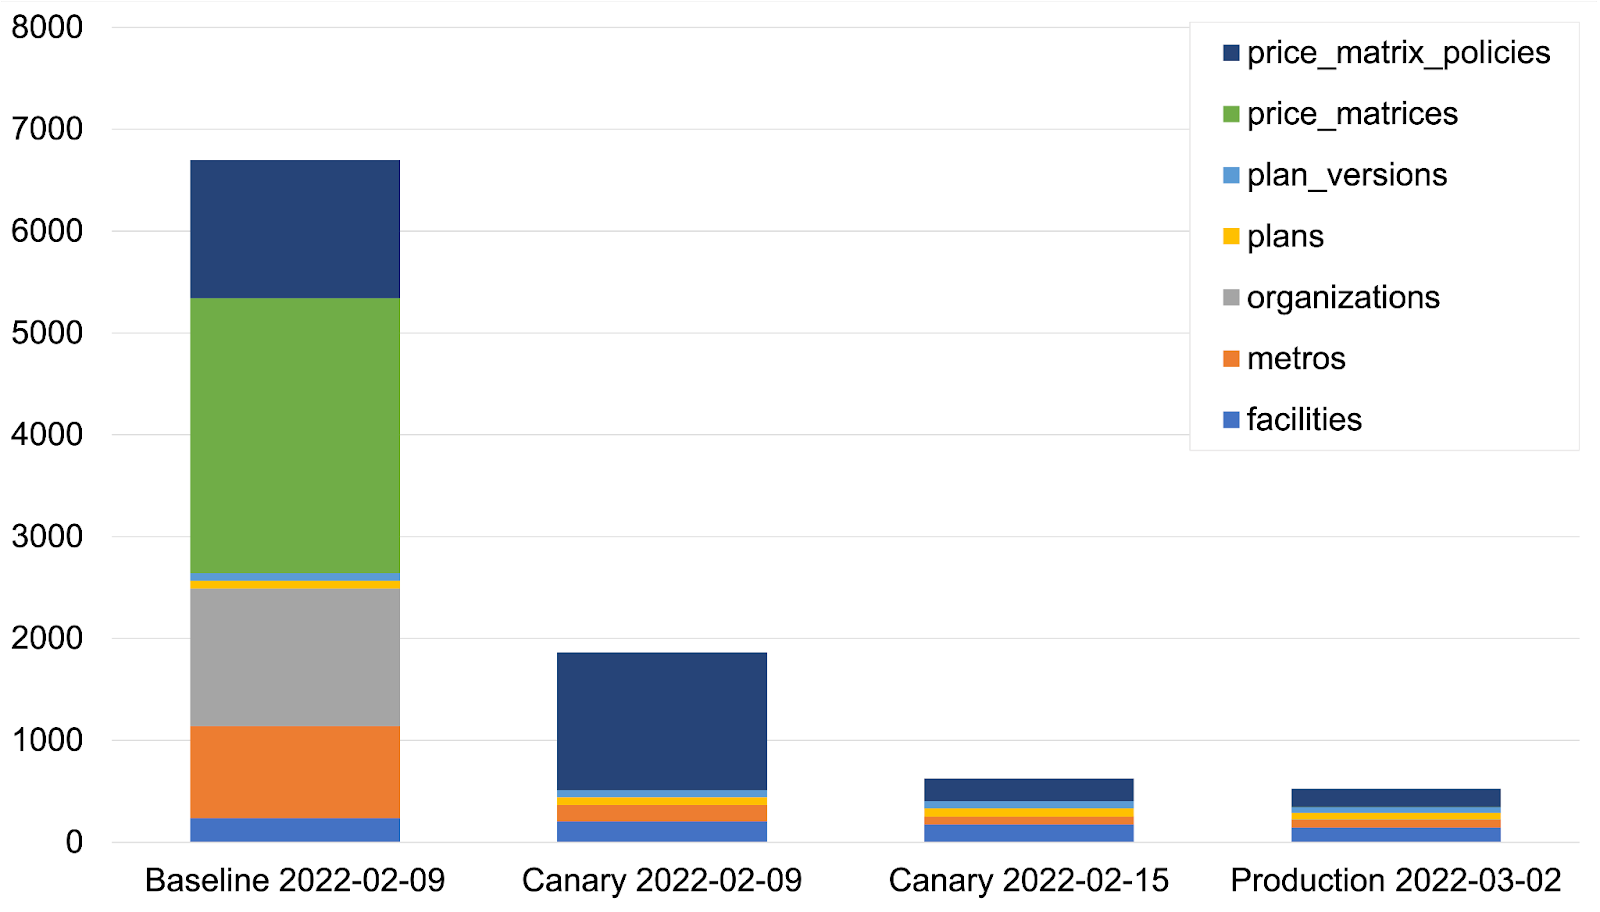
The first canarying we did was on the /plans endpoint, and we saw an immediate drop in the query count compared to the baseline. This chart shows the count from a representative request hitting different versions of the code.
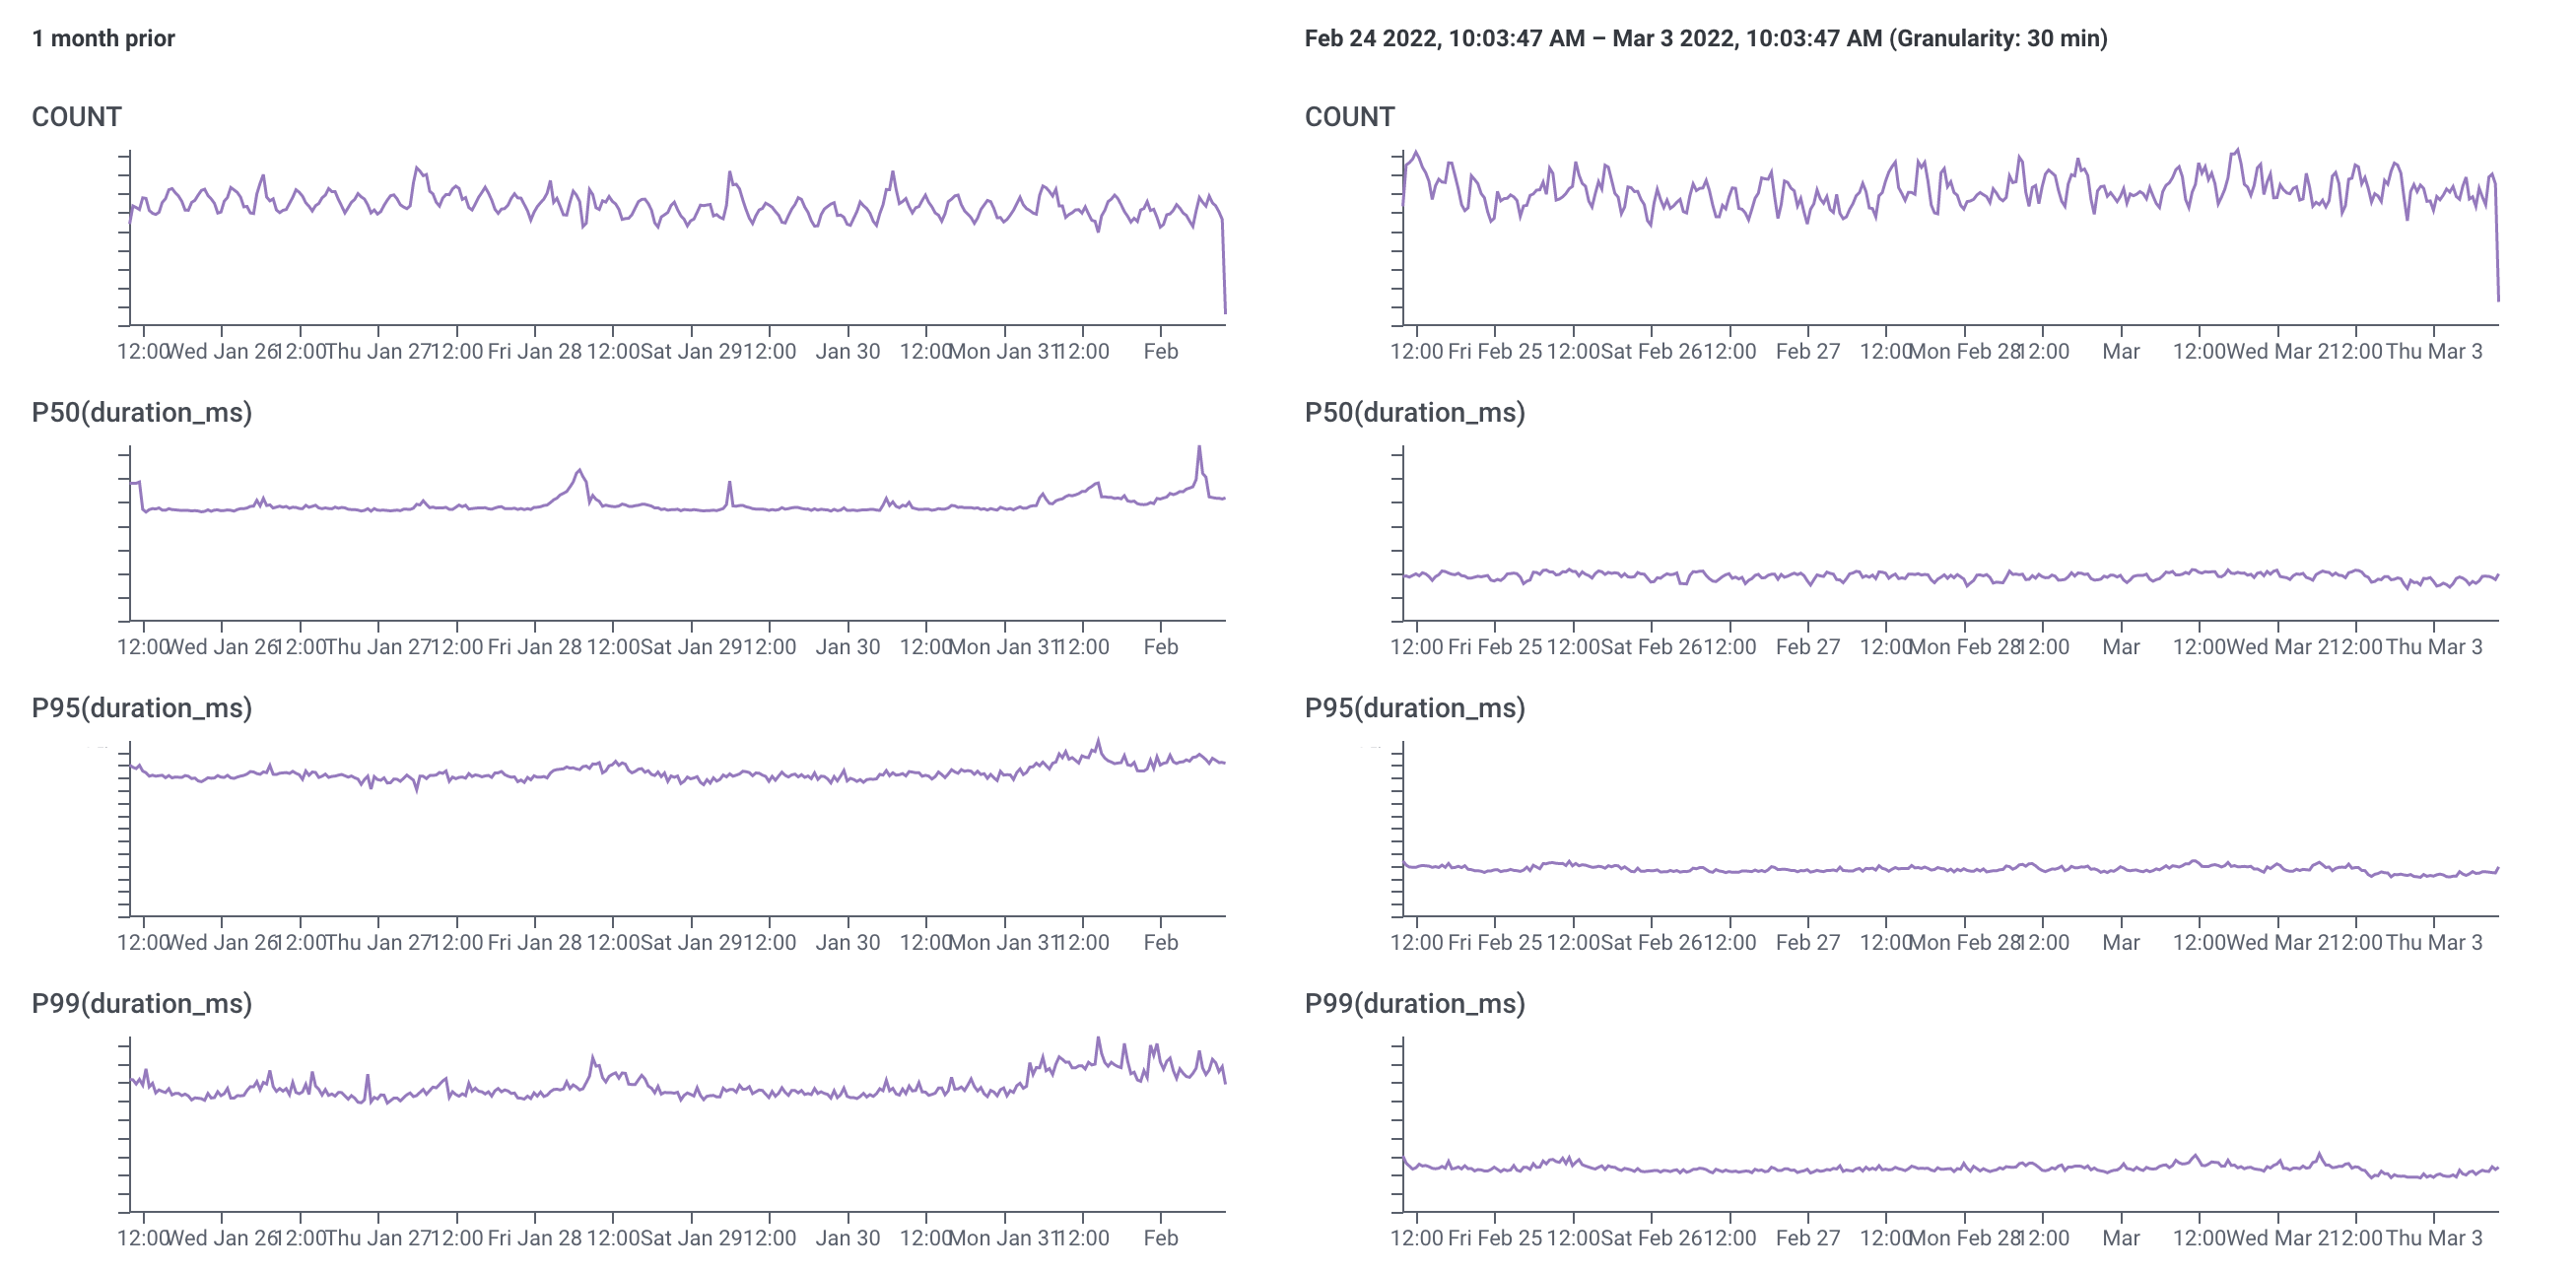
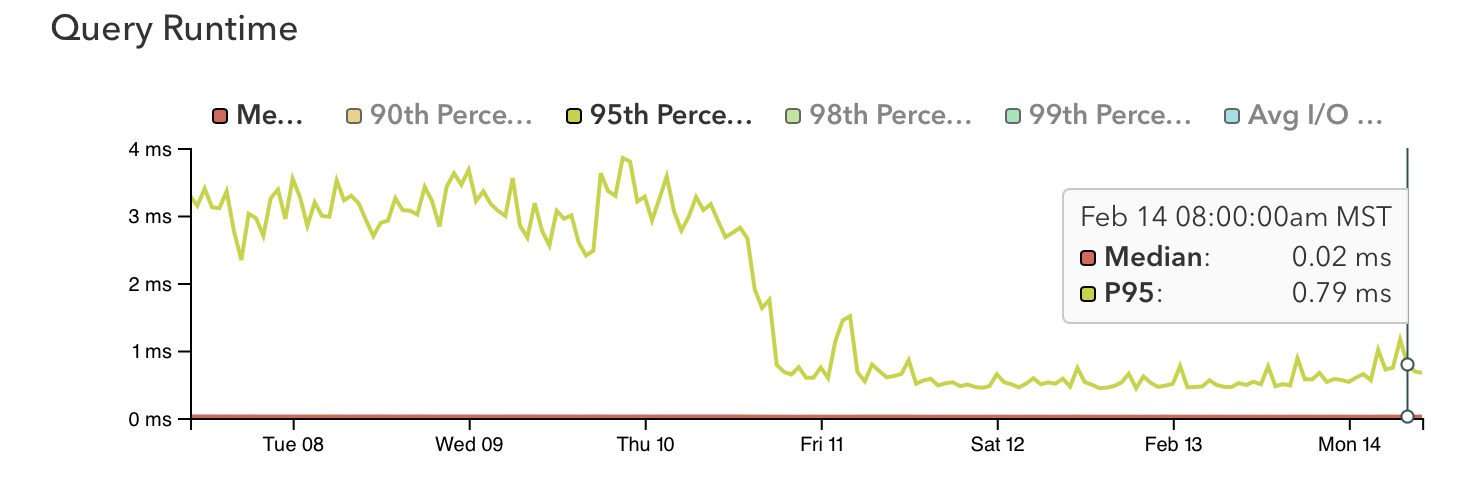
A tight feedback loop, granular traces, and the ability to query high-cardinality data made it possible to quickly iterate and test improvements, with some really great results. This is a comparison of latency for requests to the /ips endpoint at the end of January 2022 vs. the end of February 2022:
There's ongoing work to continue improving performance in the API service as well as larger projects to re-architect parts of the system and improve our data model, which will be important as we continue to grow. Still, we're thrilled to hear from customers as well as folks within Metal that they're already experiencing a noticeable improvement in portal load times.
Database Optimizations
While this post has mostly covered the code-side changes we made to address the N+1 query problem, we also saw significant performance gains thanks to some very strategic database optimizations.
Beyond the ability to observe the volume of different queries, a benefit of ActiveRecord tracing is that we gain visibility into actual query parameters without needing to increase logging at the database. Having complete query details inside traces makes it easy to get query plans from the database, both for expected query execution time as well as the outliers.
Looking at both ActiveRecord trace data and pgAnalyze (a PostgreSQL performance monitoring tool) our database engineers were able to determine two areas with clear opportunity: Planner statistics and indexing.
- Planner statistics – There are numerous blog pages and mailing list posts around how the PostgreSQL query planner uses the statistics gathered on each column to develop a query plan. In more recent versions of PostgreSQL, the ability to create custom statistics on two or more columns of correlated data can dramatically improve planner choices. Identifying a suboptimal query plan can still be challenging, but when detailed traces are just a few clicks away it gets much easier.
- Indexing – Indexing is a topic closely related to planner statistics. The query planner has to estimate that it is more effective to scan the index and then read parts of the table for those rows rather than just scan the table for a given query. Generally speaking, smaller indexes can be far more effective than larger ones, as they will be preferred when planning the query. By using partial indexes where we had larger composite indexes—which may use many columns—our indexes have become significantly smaller and much faster.
-
More Indexing – Another area around indexes in PostgreSQL is the ‘include’ clause when creating a new index. Typically indexes are based on desired filter conditions, but under certain conditions users can further improve join performance by including the column for the join condition into the index. Using include rather than a traditional composite index can be slightly more efficient when not filtering on the additional column. Included column(s) can also be highly effective when you want a single unique index on some composite of columns but want to include one that shouldn’t be considered for row uniqueness. Since indexes aren’t free, you want to be mindful of their impact to maintain.
Impact
Moving the needle in the right direction always feels good.
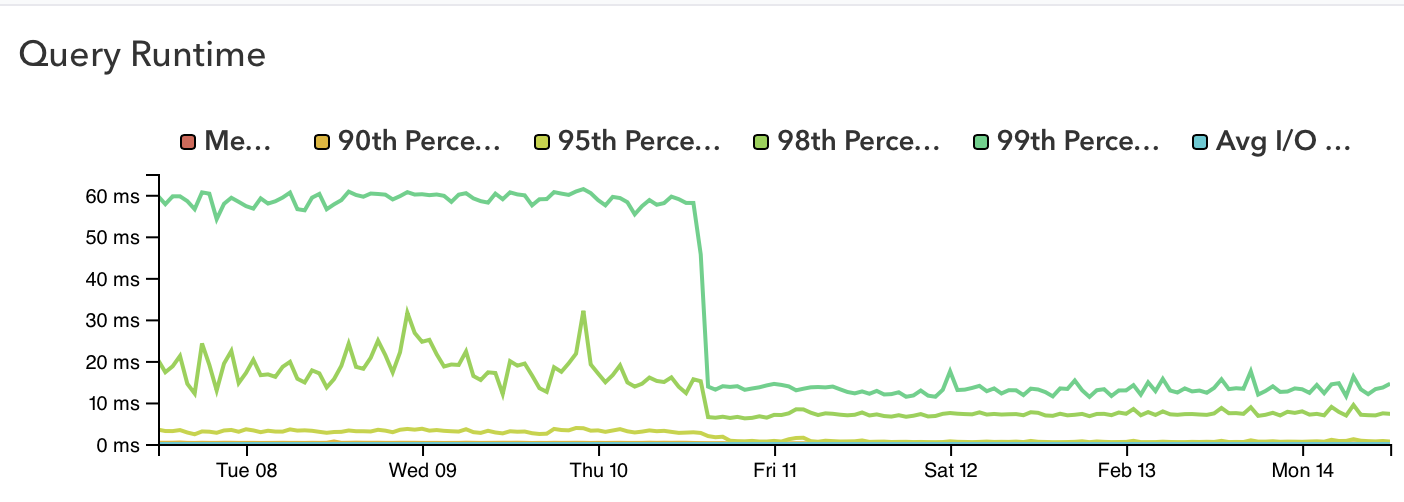
It's worth noting that these database-side optimizations occurred independently of the code-side optimization work, and were live in production weeks before the code changes rolled out. In fact, one day of database optimization work reduced overall API latency to the point that we reached our Q1 performance target overnight. Engineering leadership has since lowered the latency target by 40% and this new, stricter target is being met consistently.
We're No Heroes. We Just Had Better Data.
Database bottlenecks in Rails applications are a well-known problem, but they aren’t something customers need to live with or engineers need to paper over with caching alone. With tracing and a little bit of domain knowledge, even the most tangled monoliths can be cleaned up in a methodical, repeatable fashion.
As engineers, it's rare that we get the opportunity to make a major impact on performance in such a short amount of time. In this case, entropy and scale joined together to slow down our service and cause pain for our customers and internal teams. These were long-running, known issues that, until recently, never got bad enough to require this level of intervention. And while the team has done plenty of work over the years to reduce latency, they lacked the observability and tight feedback loops that enabled us to make such a big difference now.
The performance gains alone are worth celebrating, but this has also been an important milestone in our observability journey as an engineering organization. As Metal continues to grow in size and complexity, it'll be increasingly important for our engineers to be able to identify and debug issues across the entire stack. This performance work was a proving ground for our investments into OpenTelemetry tracing and modern observability tooling. It's not about having a couple heroes who save the day—it's about giving everyone better tools and better data, so we can all have an easier time working toward production awesomeness.
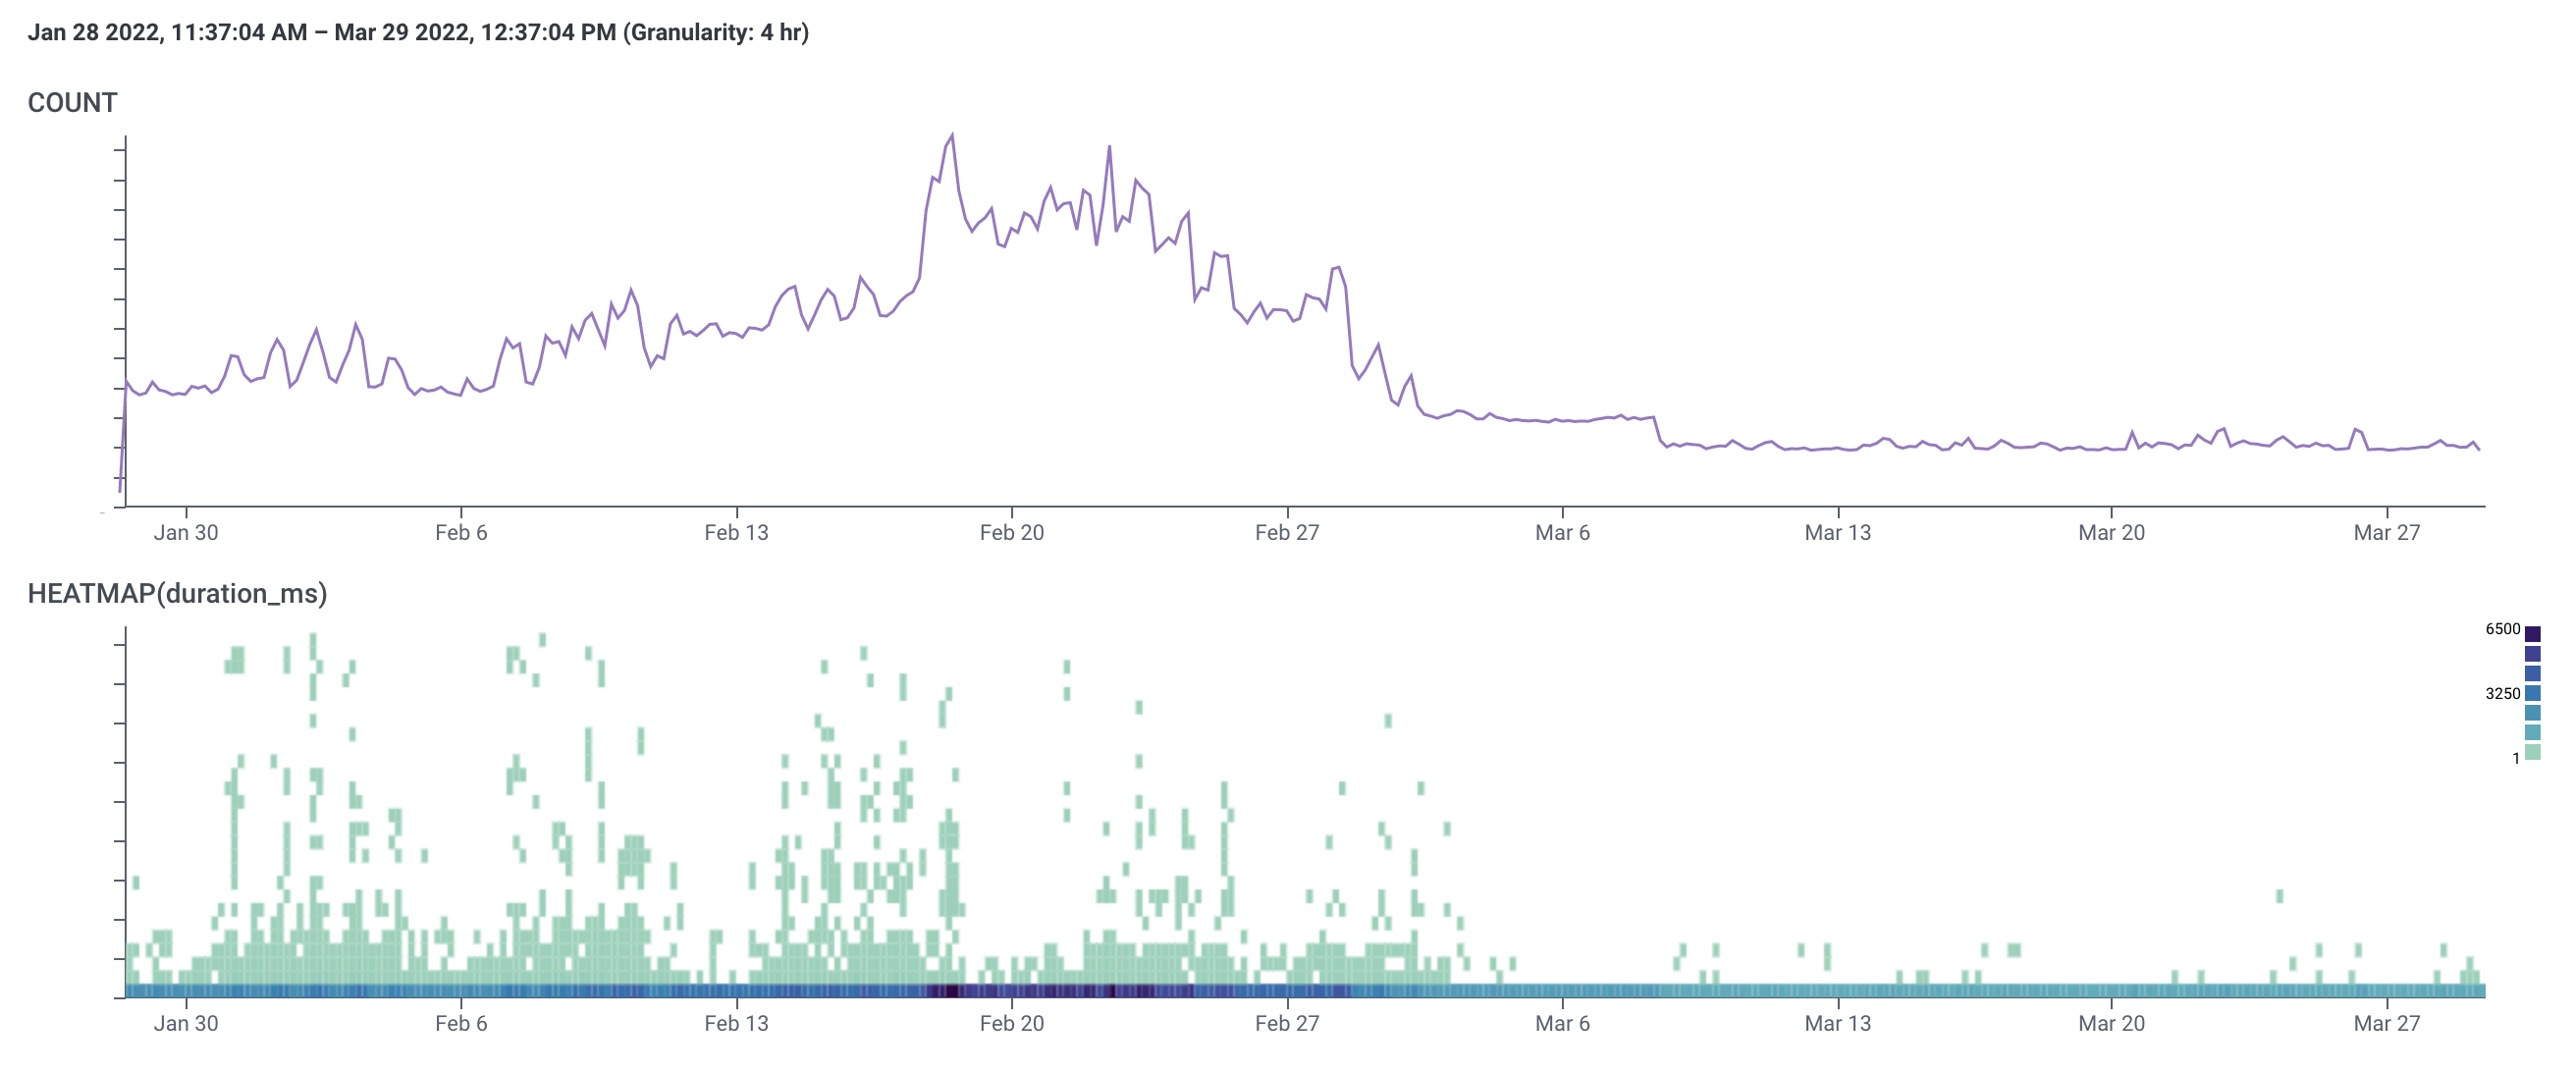
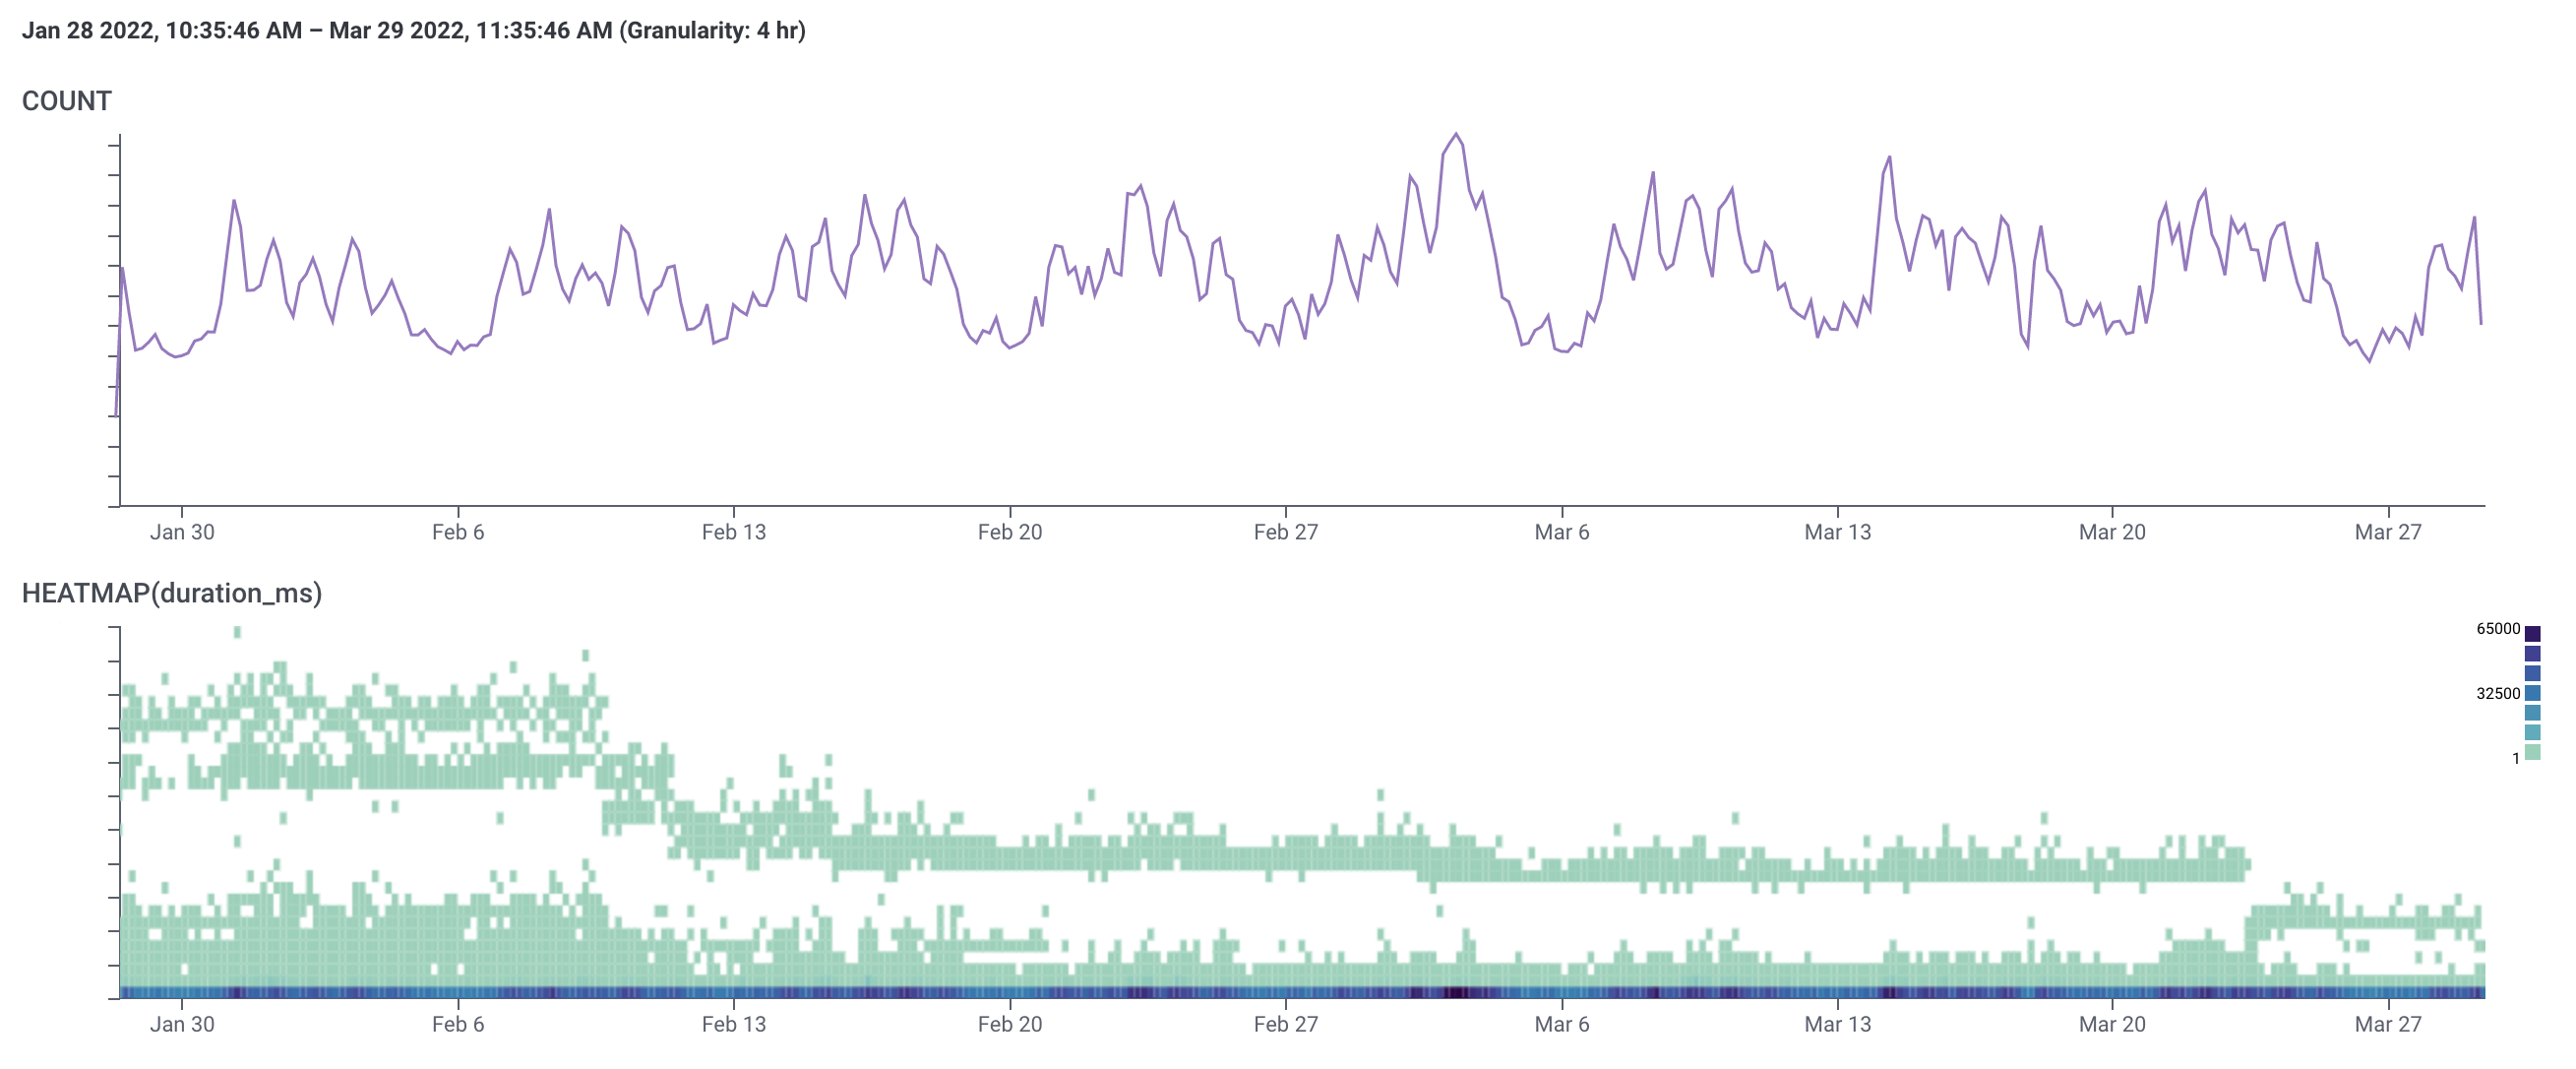
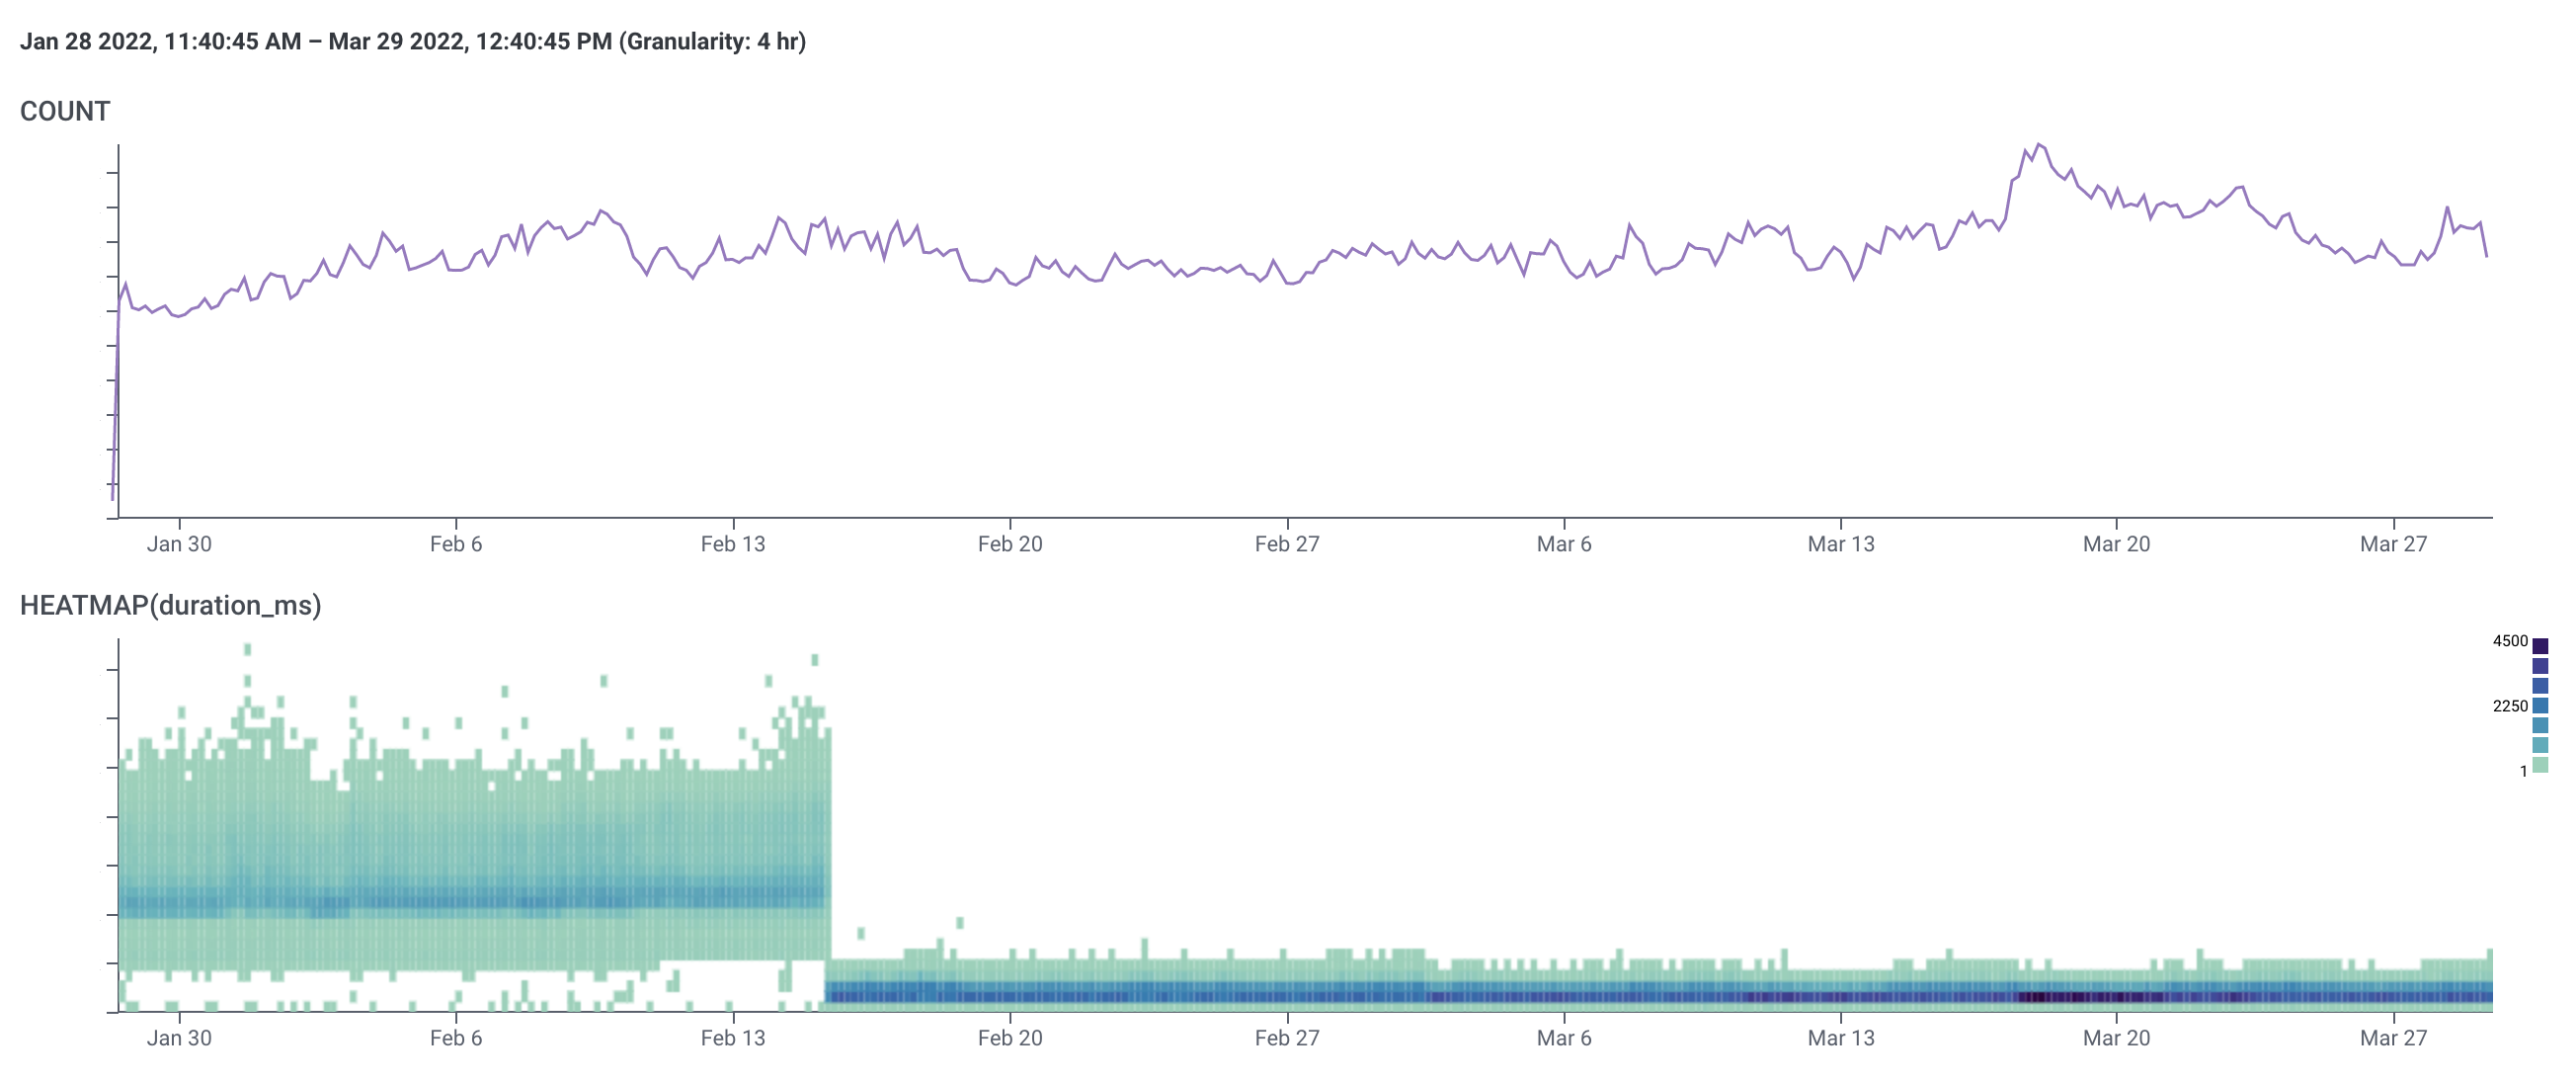
Bonus Graphs
All three graphs show data from January 28th up to March 29th.
IPs
Note the shape of the heatmap. Customers who experienced poor performance were pretty much only looking at IPs on weekdays, whereas we get fast traffic at a much more consistent volume throughout the week.
Also, a note: the increase in traffic mid-February was limited to a few customers who weren't among the outliers experiencing poor performance.
Devices
Initially we have two upper bands of slow traffic that merge into a single, relatively faster one around February 10th, which was when the database-side optimizations took place. The lower band is fast traffic, which also gets faster around that time.
We maintain those two bands until the end of March, when both drop even further thanks to a code-side improvement in how we load device data.
Plans
It's like someone wrapped our traffic in a SpaceSaver bag and vacuumed out all the latency. We shipped the code-side improvements for /plans first before the other endpoints, but this graph is so cool that we had to save it for last.

Ready to kick the tires?
Use code DEPLOYNOW for $300 credit