How to Improve Observability Using OpenTelemetry in Python
All the basics of starting to harness the power of OTel’s structured approach to observability data using one of today’s most popular programming languages.

OpenTelemetry is an open source collection of APIs and services for collecting application performance data. Result of a merger between OpenTracing and OpenCensus, it's an observability framework that standardizes the formats and methods for instrumenting, generating, collecting and exporting telemetry data.
OpenTelemetry offers vendor-neutral software development kits in several programming languages. One of them is Python, so Python application developers can use the framework to enhance observability in their systems, troubleshoot issues efficiently, optimize performance and keep their apps reliable, maintainable and performant.
In this article, we’ll explain OpenTelemetry by describing its components (traces, metrics and logs), how it collects telemetry data specifically with Python and a few best practices for using it.
More from our collection of technical blogs on OpenTelemetry and observability:
- What’s a Collector and Why Would I Want One?
- How to Use OpenTelemetry for Observability in Java
- Harnessing OpenTelemetry in Golang to Improve Observability
- OpenTelemetry and the Ghost of Provisioning Past
What Is OpenTelemetry and How Does It Work?
Observability starts with instrumenting your application so that every part of its code generates and transmits telemetry data. OpenTelemetry simplifies this step by providing tools and options for instrumenting an application automatically or manually within a cohesive framework:
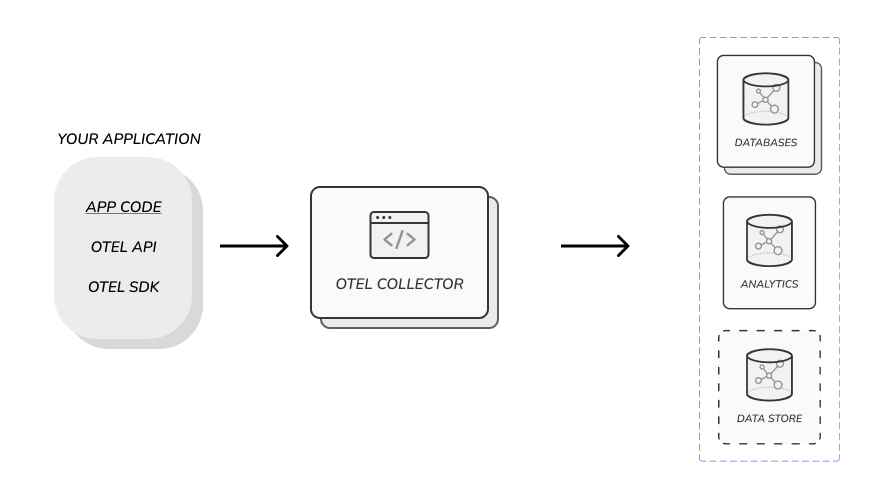
The API and language-specific SDKs included in OpenTelemetry’s architecture work together to gather data from your application or system. Once collected, this data is funneled through the OpenTelemetry protocol, a standardized format and processing mechanism. This protocol ensures consistency and compatibility across your telemetry data.
The collected data is then channeled to “collectors.” These intermediaries aggregate and prepare the data before forwarding it to your chosen destination: a storage database, analytics software or any other system that facilitates analysis and interpretation.
This structured process ensures that you get the insights you need to understand and optimize behavior and performance of the services in your architecture quickly and efficiently.
OpenTelemetry organizes its functionality into distinct categories, known as “signals,” each serving one of four specific observability purposes: traces, metrics, logs or baggage. Traces offer a broad overview of request flow, metrics quantify performance, logs record events and diagnostics and baggage facilitates contextual data propagation.
Traces
Traces provide a holistic view of the journey of requests in your application, be it a monolith or a series of interconnected microservices. This information can be used to spot bottlenecks, latency problems and potential inefficiencies.
Traces in OpenTelemetry are organized into objects, or “spans,” that resemble logs and include a wealth of event details, such as timestamps, status indicators or event contexts. There’s also a customizable array of attributes you can define according to your requirements.
Metrics
Metrics are quantitative measurements of a service's performance captured during runtime. Each measurement event, known as a “metric event,” not only records the measurement itself but also includes the time of capture and associated metadata.
Metrics communicate an app's availability and performance—essential for assessing its health. You can use custom metrics to get deeper insights into various factors’ impact on user experience or business outcomes. These data points can be used to trigger alerts, initiate automatic scaling or inform scheduling decisions to ensure optimal system operation.
Logs
Logs are time-stamped text records that capture information about events in your application. They can be structured or unstructured, and they often carry metadata alongside their content.
While logs are a longstanding and widely used data source, OpenTelemetry integrates them in a structured way. Logs in OpenTelemetry offer detailed diagnostic and debugging information, such as input details, operation results and additional contextual metadata. Logs are independent, but they can also be associated with spans in a distributed trace. OpenTelemetry considers any data that are not part of a trace or a metric to be a log, providing a comprehensive record of application activity.
Baggage
In OpenTelemetry, baggage refers to contextual information that travels with spans in a trace. It acts as a key-value store that resides in the span context and is accessible to all spans within a trace.
Baggage allows specific values to be propagated across an application's services. This is particularly useful when you need to carry contextual information (a customer ID attribute, for example) across multiple spans that originate from different services.
OpenTelemetry's Python SDK
Python is one of several language-specific OpenTelemetry SDKs. It provides a comprehensive framework for instrumenting your code to capture telemetry data, processing it to get meaningful insights and exporting it to external systems for analysis.
The OpenTelemetry Python repository contains several libraries and packages. These include the opentelemetry-api and opentelemetry-sdk, which provide abstract classes and NoOps implementations that adhere to the OpenTelemetry specification and reference implementation of the API. There are also various packages for common OpenTelemetry integrations, such as opentelemetry-exporter-prometheus (the monitoring system) and opentelemetry-propagator-jaeger (the distributed tracing observability platform).
All the packages can be easily installed using the pip package manager like this:
pip install opentelemetry-api
pip install opentelemetry-sdk
pip install opentelemetry-exporter-prometheus
pip install opentelemetry-propagator-jaeger
OpenTelemetry docs offer many examples of how the Python SDK can be used.
Best Practices for Leveraging OpenTelemetry in Python
Here are some tips for getting the most out of OpenTelemetry in Python.
Start with Automatic Instrumentation
Use OpenTelemetry's automatic instrumentation capabilities to streamline the instrumentation process and automatically integrate telemetry data collection into your application without unnecessary code modifications. Then, if you have specialized cases beyond automatic-instrumentation capabilities, you can apply manual instrumentation.
Enrich with Attributes
Enhance your telemetry data by incorporating attributes. They enable valuable metadata and offer deeper context to your observations.
For example, when instrumenting your server and monitoring requests, you can add attributes for the request method, ports and targets. Including pertinent information enriches your understanding of captured events for precise analysis and accurate troubleshooting.
Consider the Final Destination and Objectives Before Instrumenting
Where exactly you export your telemetry data and how it's used influences its granularity and depth. For example, high cardinality in data can provide deeper insights and a better understanding of specific user behaviors. Meanwhile, low cardinality works well for aggregation use cases, because it simplifies analyzing data and identifying patterns and trends.
Common Pitfalls to Avoid When Integrating OpenTelemetry in Python
Two common pitfalls can hinder a smooth and effective implementation of OpenTelemetry in Python applications: overinstrumentation and neglecting overhead monitoring.
Exercise caution to prevent overinstrumentation, which can impact performance by driving undue resource usage overhead, such as excessive CPU and memory utilization or network traffic and latency. Carefully select the segments of your codebase that truly need tracing and instrumentation to minimize resource consumption while retaining essential observability.
Also, be sure to actively monitor overhead to gauge the impact of OpenTelemetry on your application's performance. Neglecting this aspect can lead to unexpected performance bottlenecks that impede your application's responsiveness and user experience.
How to Analyze Telemetry Data
Getting actionable information from telemetry data is essential to leveraging the full potential of your observability efforts. Here are some tips and strategies to help you extract valuable insights and take action based on telemetry data:
Define Clear Objectives
Start your entire instrumentation and observability process with clear objectives and key performance indicators (KPIs) that you want to monitor and act upon. Identify specific metrics and traces that are crucial for achieving your observability goals.
Set Thresholds and Alerts
Define thresholds for critical metrics and set up alerts to trigger notifications when those thresholds are breached. These alerts can help you respond proactively to abnormal conditions in your applications or systems.
Document Insights and Actions
Document the insights you've gained from telemetry data analysis and the actions you took based on those insights. This documentation process will help share knowledge in your organization and learn from past experiences with your application's performance.
Use Visualization Tools
Visualization tools and dashboards can help you represent telemetry data in a visually intuitive manner. Graphs, charts and histograms help you spot trends, anomalies and patterns.
Compatible Tools and Platforms for OpenTelemetry
OpenTelemetry is designed to be vendor-agnostic and supports a variety of tools and platforms for data visualization and analysis. The following tools are some of the popular options for receiving telemetry data exported by OpenTelemetry and providing rich insights into the behavior and performance of your applications:
Prometheus
Prometheus is an open source monitoring and alerting system that can ingest metrics data from OpenTelemetry. It lets you create custom dashboards, set up alerting rules and perform in-depth analysis of your application's performance metrics.
Jaeger
Jaeger is a popular open source distributed tracing system that is compatible with OpenTelemetry. It lets you explore traces, understand request flows, perform root cause analysis and identify latency bottlenecks in your distributed systems.
Grafana
Grafana is a popular observability visualization platform that can be used with OpenTelemetry or other data sources. It lets you build customizable dashboards and visualizations for your telemetry data.
Conclusion
Integrating OpenTelemetry with your systems helps you capture, process and analyze telemetry data to get a holistic understanding of application behavior and performance. Building on this article as a jumping-off point for using it in Python, dig into the official OpenTelemetry documentation for Python, as well as tutorials and guides.

Ready to kick the tires?
Use code DEPLOYNOW for $300 credit