Harnessing OpenTelemetry in Golang to Improve Observability
How to get started using the most versatile open source observability framework to instrument your Go application.

You cannot improve what you cannot measure, you cannot fix most problems without knowing their root cause, and you certainly cannot fix a problem you don’t know exists. Observability, a concept developed in the realm of engineering of physical systems and in recent years adopted in the world of software and IT systems, is meant to address all three of these “cannots.”
A prerequisite of observability is feedback from the system being observed. In IT systems this feedback comes in the form of telemetry data emitted from just about every component up and down the hardware and software stack. One of the most popular frameworks for collecting this data from today’s highly distributed cloud-native applications is OpenTelemetry. An open source project that’s part of the Cloud Native Computing Foundation (CNCF), it provides APIs for tracing, metrics and logs.
The project includes SDKs for numerous popular programming languages. One of them is Golang, and this article is an introduction to instrumenting Go applications using the OpenTelemetry Go SDK, common methods for analyzing telemetry data effectively and best practices and potential pitfalls therein.
We have published similar guides for other OpenTelemetry SDKs:
- How to Improve Observability Using OpenTelemetry in Python
- How to Use OpenTelemetry for Observability in Java
The Mechanics of OpenTelemetry
OpenTelemetry offers a set of APIs, libraries, agents and instrumentation to facilitate telemetry data collection from applications. This data is crucial for monitoring, debugging and optimizing application performance.
The framework provides a unified way to ingest observability data and then export it to a variety of backends for analysis and visualization:
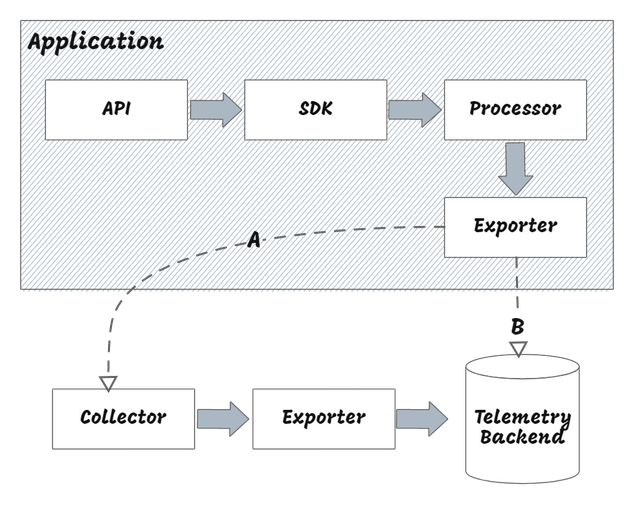
The following are the key components of OpenTelemetry:
- APIs and SDKs: OpenTelemetry language-specific SDKs capture telemetry data from applications, while OpenTelemetry APIs define the interfaces for capturing it. There are SDKs for a variety of languages, including Go, Java, Python and C++. They provide a bridge between the APIs and the exporters, which are responsible for exporting the captured data to backends.
- Collectors: These are processes that receive the data, process it and export it to specified backends, ensuring consistent and efficient data flow. The application can either use the Exporter API to send processed telemetry data directly to a backend or offload the responsibility to the Collector. The Collector is a crucial component of OpenTelemetry. If you aren’t familiar with it, these two articles provide a comprehensive overview:
- OpenTelemetry Protocol: A standard format for exporting telemetry data, OTLP is a wire protocol that defines the format and structure of telemetry data. It is used by the Collector to receive and process telemetry data from applications.
OpenTelemetry Signals
OpenTelemetry currently supports three core signals for capturing telemetry data:
- Traces provide a view of a request's path through various services. Each trace is made up of spans, each span representing an operation, such as a database query or an HTTP request.
- Metrics are quantitative measurements that give information about the application's performance and health. They can be counters (e.g. total requests), gauges (e.g. memory usage) or histograms (e.g. request latency distribution).
- Logs are textual records generated by applications. They offer detailed information about events, errors and other significant occurrences.
The OpenTelemetry Go SDK
The OpenTelemetry Go SDK is designed to integrate with Go applications and provides interfaces for capturing traces and metrics. The current status (as of September 2023) of the Go SDK for telemetry signals is as follows:
| Traces | Metrics                               | Logs            |
| ---    | ---                                   | ---             |
| Stable | Mixed (SDK in beta and API is stable) | Not implemented |
Find the latest status in official documentation for the SDK
Set Up the Go SDK
Traces are the most used kind of signal in OpenTelemetry because they help identify bottlenecks and latency in your system. In the following sections, you'll learn how to use the Go SDK to capture traces from a Go application.
To work with OpenTelemetry in Go, implement the following workflow:
First, use the go get command to obtain the latest version of the following SDKs:
go get go.opentelemetry.io/otel \
go.opentelemetry.io/otel/exporters/stdout/stdouttrace \
go.opentelemetry.io/otel/sdk \
go.opentelemetry.io/otel/trace
Then, define exporters, samplers and instrumentation to specify how and where your data will be captured and sent.
Finally, instrument your code using the SDK's APIs to capture relevant telemetry data and use an exporter to send it to the backend.
For more detailed setup instructions, refer to the "Getting Started" guide the OpenTelemetry Go SDK documentation.
Instrument a Go Application with OpenTelemetry
To demonstrate use of OpenTelemetry in a Go application, you'll work with a simple CLI-based To-Do app that allows the user to add tasks to an in-memory list and display them.
The source code for this application is available on GitHub, and it’s primarily composed of the following files:
main.gois the entry point for the application. It contains themain()function, which is responsible for starting the application and handling user input. It invokes either the instrumented or non-instrumented (vanilla) version of the application based on the value of theexecuteVanillavariable.vanilla.gois the non-instrumented version of the application.instrumented.gois the instrumented version of the application.
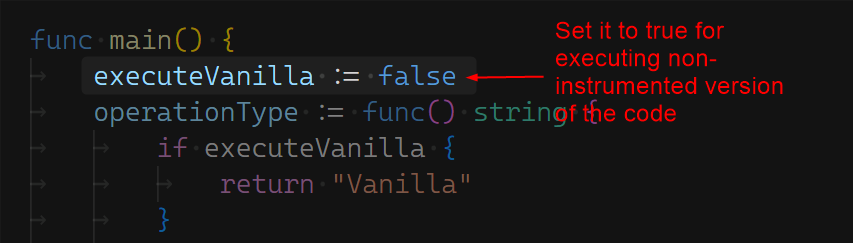
Before walking through the application code, take a look at the output of the instrumented and non-instrumented versions of the application. The instrumentation level of the application is controlled through a boolean variable, executeVanilla, in the main.go file. You can set the variable value to true to run the non-instrumented version and false to run the instrumented version.
Before executing the application, set the value of the executeVanilla variable to true:
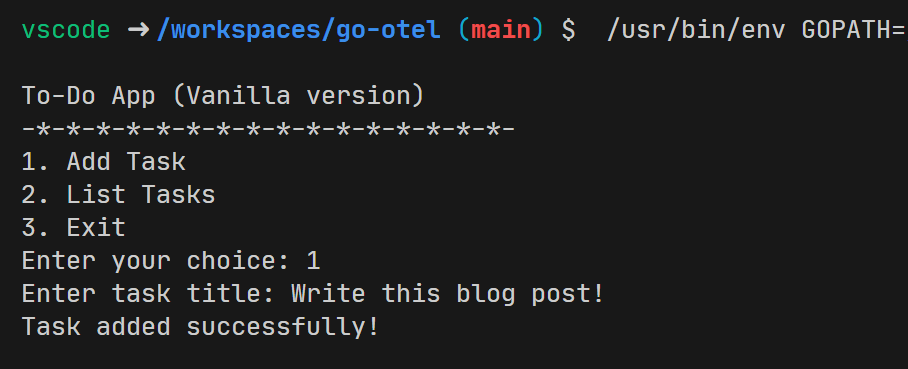
The following is a sample run of the application from the Visual Studio Code terminal:
Start by selecting option 1 to add a task and enter the task title:
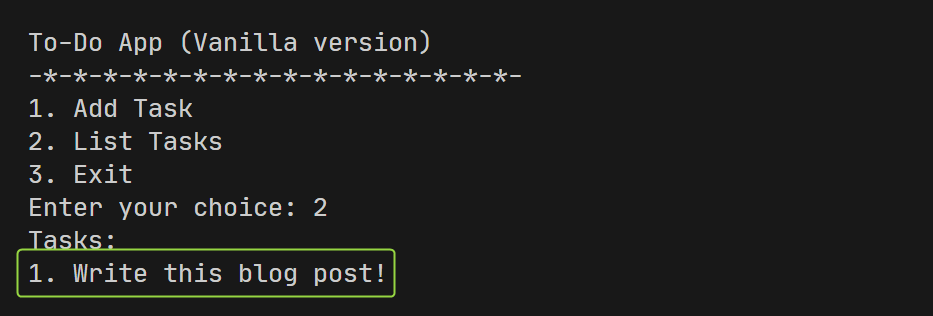
Then select option 2 to list all the tasks:
Now, set the variable executeVanilla to false to run the instrumented version. Then select option 1 to add a task and enter the task title:
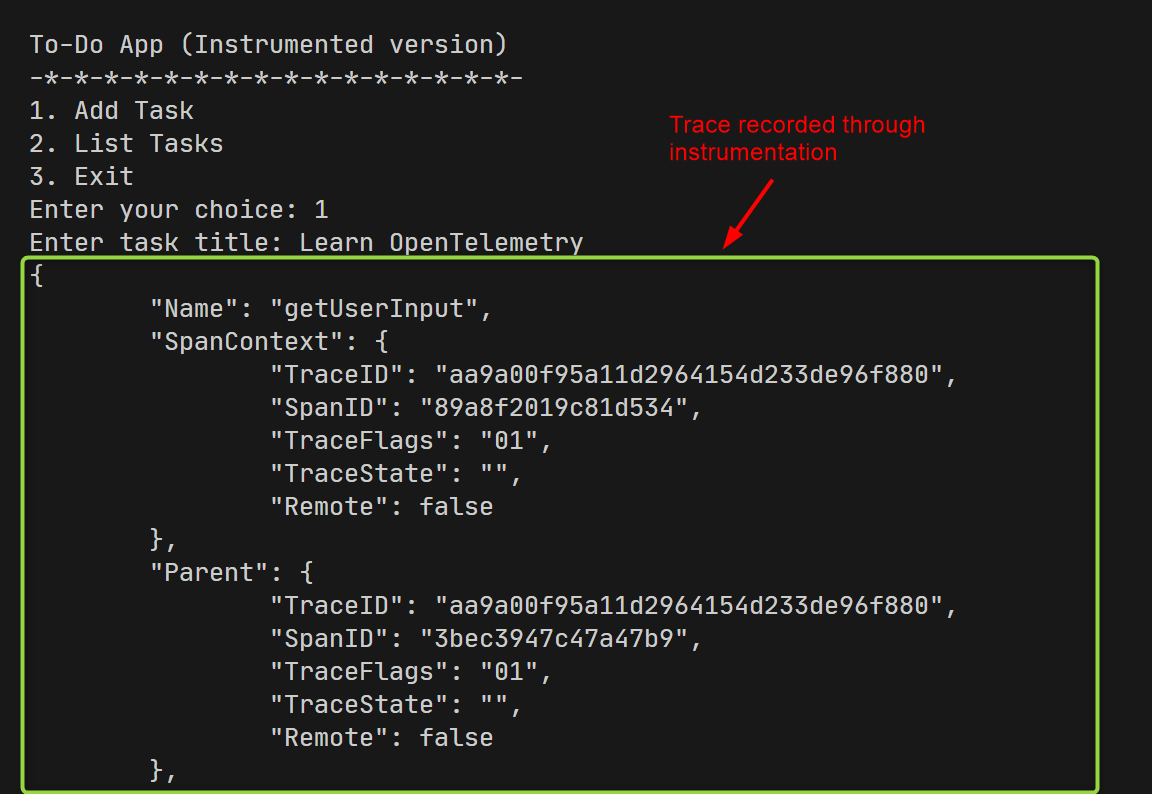
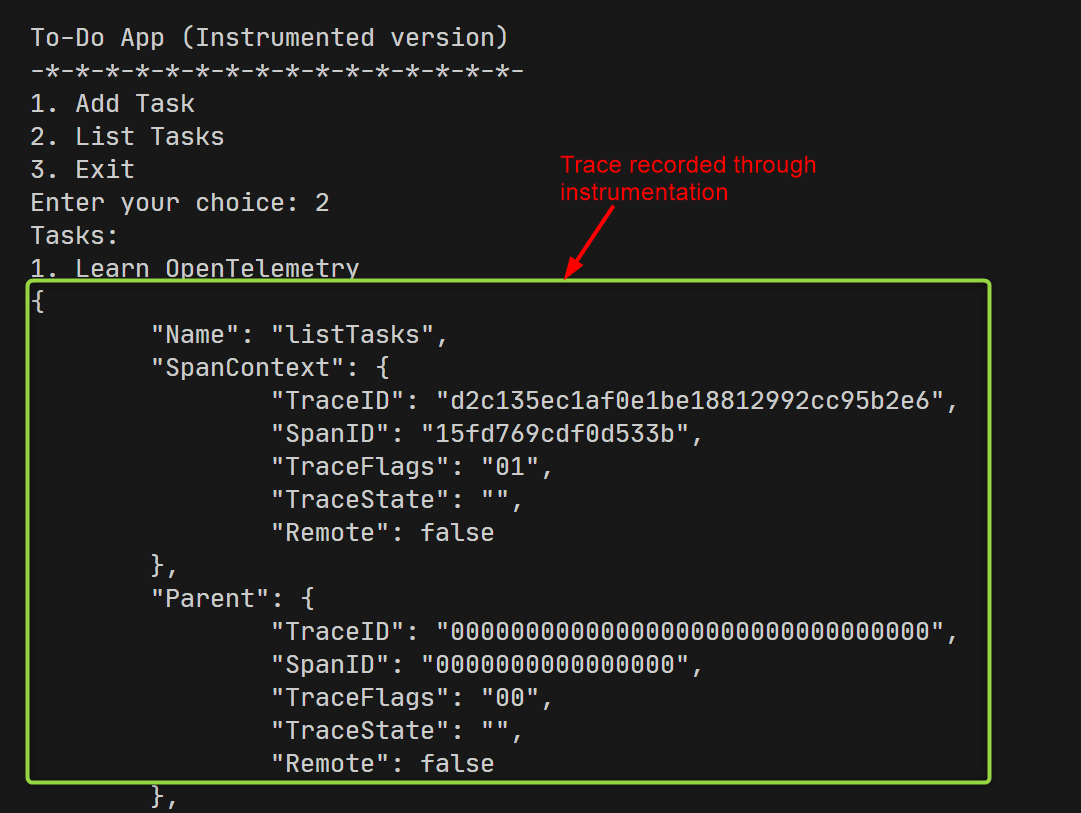
Again, select option 2 to list all tasks:
Following is the business logic of the vanilla version of the To-Do app:
package main

import (
	"bufio"
	"fmt"
	"os"
	"strings"
)

func executeChoice(choice int) {
	switch choice {
	case 1:
		addTask()
	case 2:
		listTasks()
	case 3:
		fmt.Println("Exiting...")
		os.Exit(0)
	default:
		fmt.Println("Invalid choice. Please select a valid option.")
	}
}

func addTask() {
	fmt.Print("Enter task title: ")
	reader := bufio.NewReader(os.Stdin)
	title, err := reader.ReadString('\n')
	title = strings.TrimSuffix(title, "\n")
	if err != nil {
		fmt.Println("An error occured while reading input. Please try again", err)
		return
	}

	idCounter++
	task := Task{
		ID:    idCounter,
		Title: title,
	}
	tasks = append(tasks, task)
	fmt.Println("Task added successfully!")
}

func listTasks() {
	if len(tasks) == 0 {
		fmt.Println("No tasks available.")
		return
	}
	fmt.Println("Tasks:")
	for _, task := range tasks {
		fmt.Printf("%d. %s\n", task.ID, task.Title)
	}
}
In this code, the executeChoice function handles user input and invokes the appropriate function based on the user's choice. The addTask function adds a task to the in-memory list, and the listTasks function displays all tasks in the list.
The following code snippet shows the main function, which is responsible for starting the application and handling user input:
package main

import "fmt"

// Task represents a single to-do item
type Task struct {
	ID    int
	Title string
}

var tasks []Task
var idCounter int

func main() {
	executeVanilla := false
	operationType := func() string {
		if executeVanilla {
			return "Vanilla"
		}
		return "Instrumented"
	}()

	for {
		fmt.Printf("\nTo-Do App (%s version)\n", operationType)
		fmt.Println("-*-*-*-*-*-*-*-*-*-*-*-*-*-*-*-*-")
		displayMenu()
		choice := getUserChoice()

		if executeVanilla {
			// Vanilla
			executeChoice(choice)
		} else {
			// Instrumented
			executeChoiceInstrumented(choice)
		}
	}
}

func displayMenu() {
	fmt.Println("1. Add Task")
	fmt.Println("2. List Tasks")
	fmt.Println("3. Exit")
	fmt.Print("Enter your choice: ")
}

func getUserChoice() int {
	var choice int
	_, err := fmt.Scan(&choice)
	if err != nil {
		fmt.Println("Invalid input. Please enter a number.")
		return 0
	}
	return choice
}
In the main function, the executeVanilla variable is used to determine whether the instrumented or non-instrumented version of the application should be executed. The operationType variable is used to display the appropriate version of the application being executed.
The displayMenu function displays the menu options to the user, and the getUserChoice function reads the user's choice from the console. Then the main function invokes the executeChoice or executeChoiceInstrumented function based on the value of the executeVanilla variable.
To instrument this application with OpenTelemetry, you'll add traces to the addTask function, creating a parent span for the entire task addition process and child spans for individual steps within that process.
Here's the instrumented version of the application:
package main

import (
	"bufio"
	"context"
	"fmt"
	"log"
	"os"
	"strings"

	"go.opentelemetry.io/otel"
	"go.opentelemetry.io/otel/exporters/stdout/stdouttrace"
	sdktrace "go.opentelemetry.io/otel/sdk/trace"
	"go.opentelemetry.io/otel/trace"
)

var tracer trace.Tracer

func init() {
	// Initialize OpenTelemetry
	initOpenTelemetry()
}

func initOpenTelemetry() {
	// Create a new export pipeline using stdout exporter
	// This will show traces in the console
	exporter, err := stdouttrace.New(stdouttrace.WithPrettyPrint())
	if err != nil {
		log.Fatalf("failed to initialize stdout export pipeline: %v", err)
	}

	// Configure the SDK with the exporter, trace provider, and default sampler
	bsp := sdktrace.NewSimpleSpanProcessor(exporter)
	tp := sdktrace.NewTracerProvider(sdktrace.WithSpanProcessor(bsp))
	otel.SetTracerProvider(tp)

	// Get a tracer instance from the global trace provider
	tracer = otel.Tracer("todo-app")
}

func executeChoiceInstrumented(choice int) {
	switch choice {
	case 1:
		addTaskInstrumented()
	case 2:
		listTasksInstrumented()
	case 3:
		fmt.Println("Exiting...")
		os.Exit(0)
	default:
		fmt.Println("Invalid choice. Please select a valid option.")
	}
}

func addTaskInstrumented() {
	// Start a new span for the addTask function
	var ctx, span = tracer.Start(context.Background(), "addTaskProcess")
	defer span.End()

	// Child span for getting user input
	_, inputSpan := tracer.Start(ctx, "getUserInput")
	fmt.Print("Enter task title: ")
	reader := bufio.NewReader(os.Stdin)
	title, err := reader.ReadString('\n')
	title = strings.TrimSuffix(title, "\n")
	if err != nil {
		fmt.Println("An error occured while reading input. Please try again", err)
		return
	}
	inputSpan.End()

	// Child span for updating the in-memory list
	_, updateSpan := tracer.Start(ctx, "updateTaskList")
	idCounter++
	task := Task{
		ID:    idCounter,
		Title: title,
	}
	tasks = append(tasks, task)
	updateSpan.End()

	// Add an event to the span for task addition
	span.AddEvent("Task Added", trace.WithAttributes())
	span.End()

	fmt.Println("Task added successfully!")
}

func listTasksInstrumented() {
	// Start a new span for the listTasks function
	var _, span = tracer.Start(context.Background(), "listTasks")
	defer span.End()

	if len(tasks) == 0 {
		fmt.Println("No tasks available.")
		return
	}
	fmt.Println("Tasks:")
	for _, task := range tasks {
		fmt.Printf("%d. %s\n", task.ID, task.Title)
	}

	// Add an event to the span for task listing
	span.AddEvent(fmt.Sprintf("Listed %d tasks", len(tasks)), trace.WithAttributes())
}
The initOpenTelemetry function initializes OpenTelemetry and configures the SDK with the stdout exporter. The executeChoiceInstrumented function is similar to the executeChoice function in the vanilla version, except that it invokes the instrumented versions of the addTask and listTasks functions.
The addTaskInstrumented function is the instrumented version of the addTask function. It creates a parent span, addTaskProcess, for the entire task addition process and adds child spans, getUserInput and updateTaskList, for individual steps within that process.
The AddEvent function is used to add an event to the span for task addition. Events are used to capture significant occurrences within the application.
The listTasksInstrumented function is the instrumented version of the listTasks function. It creates a span for the entire task listing process and adds an event to the span for task listing.
Visualize Traces
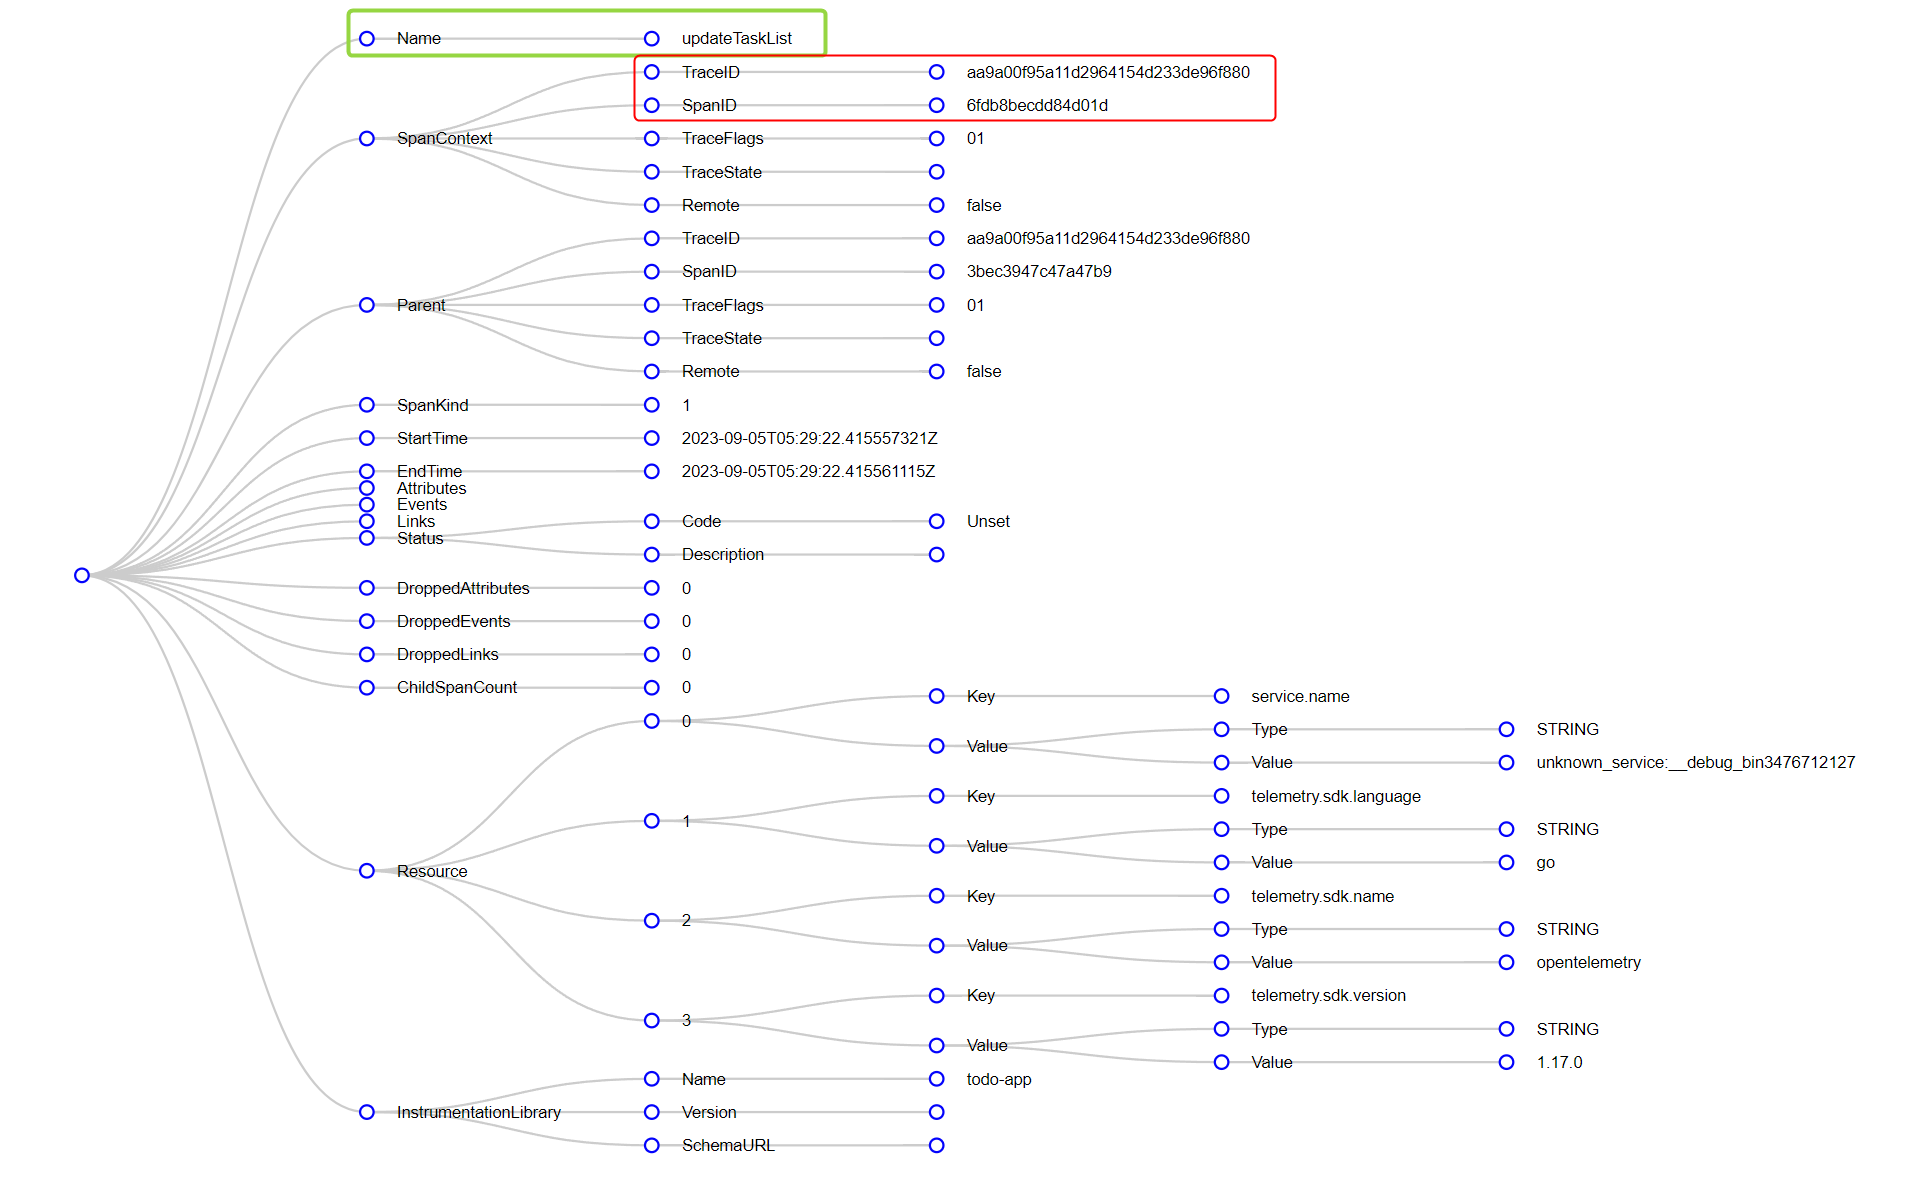
The following diagram shows a graphical representation of traces captured by the instrumented version of the application during the execution of the addTaskInstrumented function:
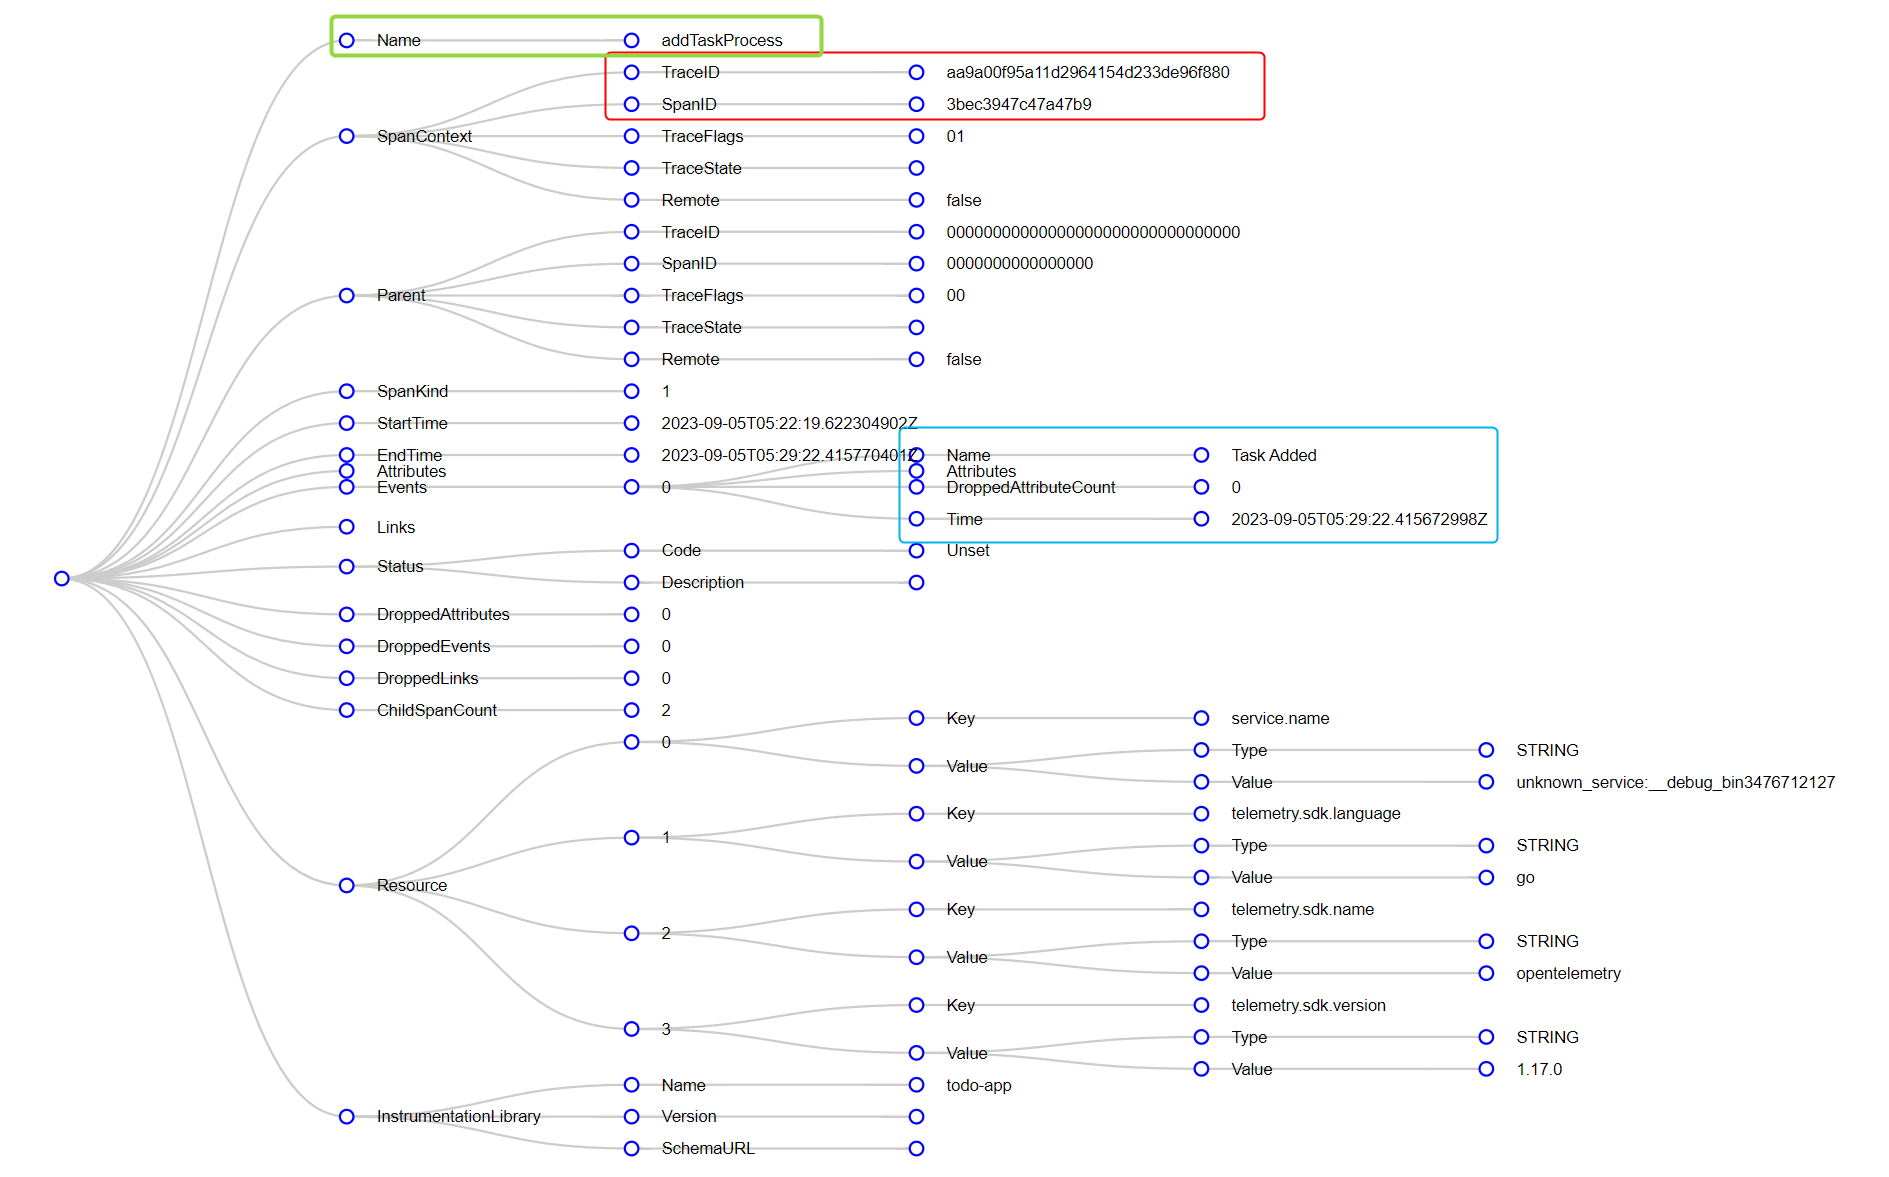
Here you see the addTaskProcess span for the entire task addition process. Since it's the parent span it has a unique TraceID and SpanID. The TraceID is the same as the TraceID for the child spans, but the SpanID is different for each span. Additionally, it includes the Task Added event, which was added using the AddEvent function.
This diagram shows the getUserInput span for getting user input:
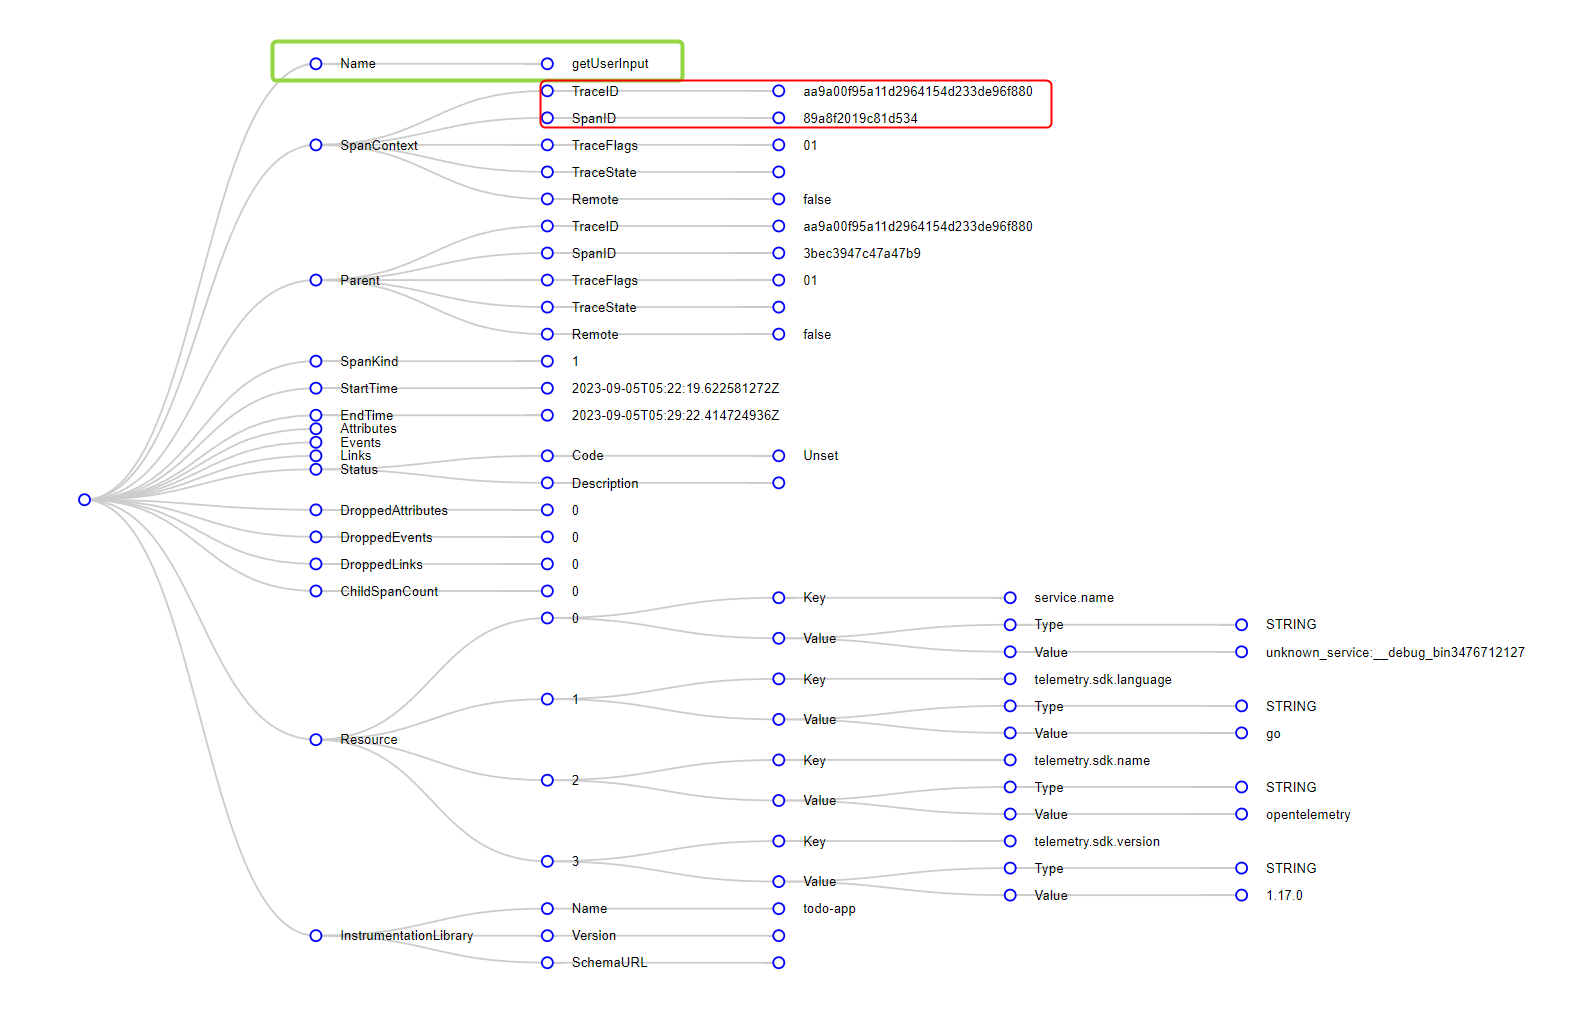
Note the TraceID and SpanID for this span. The TraceID is the same as the parent span, but the SpanID is different. This is because the getUserInput span is a child span of the addTaskProcess span.
Here you see the updateTaskList span for updating the in-memory list:
The TraceID is the same as the parent span, but the SpanID is different. This is because the updateTaskList span is a child span of the addTaskProcess span.
In production, the traces captured by OpenTelemetry can be visualized using tools such as Jaeger and Zipkin. These tools provide a graphical representation of traces, making it easier to understand the flow of requests through the application.
Best Practices for Leveraging OpenTelemetry with Go
Here are some recommendations for ensuring effective instrumentation with OpenTelemetry in Go.
Ensure Context Propagation
Make sure you properly propagate the context (which carries trace identifiers and other metadata) across service boundaries. Maintaining trace continuity is especially vital in asynchronous operations or instances when a request travels through multiple microservices.
By ensuring consistent context propagation traces remain unbroken, providing a complete picture of a request's journey.
Update Your SDKs Regularly
The OpenTelemetry project is continually evolving, with frequent updates introducing new features, optimizations and security patches. When you keep your SDKs up to date, developers can leverage all those enhancements.
Instrument Code Selectively
While it might seem appealing to instrument every part of an application, it's more beneficial to focus on the most critical paths first. This approach reduces noise in the data and ensures that the overhead of instrumentation doesn't outweigh its benefits, making it easier to pinpoint issues.
Here are some tips to help you decide which parts of your application to instrument:
- Instrument the most critical paths first. These critical paths are typically the parts of your application that are most likely to cause issues or bottlenecks, such as database queries, external API calls or complex business logic.
- Instrument code that is responsible for handling user requests or processing data, as these are often the areas where performance issues can arise.
- Start with a small set of instrumentation and gradually expand it as needed.
Use Semantic Conventions
OpenTelemetry provides semantic conventions that offer a standard naming system for spans, attributes and events. By adhering to these conventions, developers ensure consistency across different services and tools, simplifying data correlation.
Pitfalls When Using OpenTelemetry with Go
There are also a few pitfalls you should try to avoid.
Overinstrumentation
Adding too many spans or logging excessive data can lead to performance overhead and make telemetry data harder to analyze. It's essential to strike a balance and only instrument the necessary parts of the application.
Ignored Errors
Not capturing or logging errors can lead to blind spots in observability. Ensure that the instrumentation captures all exceptions and errors, providing a holistic view of the application's health.
Misconfigured Exporters
Incorrectly configured exporters can lead to data loss or incomplete traces. Regularly review and test the configuration to ensure data is correctly sent to the desired backend or analysis tool.
Review Resource Limits
OpenTelemetry SDKs often have default limits on the number of attributes, events and links that can be added to spans. Not being aware of or adjusting these limits can lead to truncated or incomplete data.
Performance Optimizations
While OpenTelemetry is designed to be lightweight, it's important to optimize your instrumentation code to ensure that it doesn't impact your application’s performance. Here are some tips to help you optimize your instrumentation code:
Limit span data. Only capture essential attributes, events and links within spans. Excessive data can increase overhead and storage costs.
Use batching exporters to send telemetry data. Sending data in batches reduces the number of outbound network calls, improving application performance.
Implement rate limiting for telemetry data, especially if you're dealing with high-throughput systems. This ensures that the system doesn't get overwhelmed with too much telemetry data, which can degrade performance.
Use adaptive sampling strategies to capture a representative subset of the telemetry data. This reduces the volume of data sent and stored while still providing valuable insights.
Use asynchronous export mechanisms to send data. This ensures that the main application threads are not blocked, waiting for telemetry data to be exported.
Optimize storage. If you're storing telemetry data, ensure that the storage system (like a time series database) is optimized for write-heavy operations.
Review instrumentation regularly. Periodically review and prune unnecessary instrumentation from your application. Over time, some telemetry points can become redundant or less valuable.
Telemetry Data Analysis
Telemetry data provides a wealth of information about an application’s behavior and performance, but the sheer volume and complexity of this data can be overwhelming. Proper analysis is crucial to extracting meaningful insights and driving actionable outcomes. Here are some of the tools and practices you can implement when analyzing telemetry data.
Use Data Visualization Tools
OpenTelemetry data can be exported to various backend platforms that offer visualization tools. Platforms like Grafana, Jaeger and Zipkin provide intuitive dashboards to visualize traces, metrics and logs. Using them, developers can quickly identify patterns, anomalies or bottlenecks in the application.
It's essential to choose a platform that aligns with your application's scale and the granularity of insights you seek.
Correlate Your Data
One of the primary benefits of OpenTelemetry is the ability to correlate traces, metrics and logs. For instance, if a particular service shows increased latency, correlating this with logs can provide context on errors or exceptions that might be causing the delay. This holistic view allows for a deeper diagnostic process, pinpointing the root cause of issues rather than treating symptoms.
Aggregate Metrics Data
Metrics by nature can generate vast amounts of data, especially in high-throughput systems. Aggregating metrics data (such as calculating averages, percentiles or sums over specific intervals) can provide a more digestible view of system performance.
Tools like Prometheus can be instrumental in performing such aggregations, transforming raw metrics into actionable insights.
Implement Alerting Mechanisms
Merely collecting and visualizing data isn't enough. Real-time alerting mechanisms can be set up based on predefined thresholds or anomalies. For instance, if the error rate for a service exceeds a certain percentage, or if latency goes beyond an acceptable limit, an alert can be triggered. This approach helps ensure that issues are addressed proactively, before they escalate and cause more significant problems.
Analyze Historical Data
While real-time data provides insights into the current health of the application, historical data is invaluable for identifying trends. By comparing current performance metrics with historical data, developers can identify patterns, anticipate potential issues and gauge the impact of changes or updates made to the application.
Maintain a Continuous Feedback Loop
Telemetry data analysis should be an ongoing process, feeding into the development and operations cycle. Regular reviews of this data can inform code optimization, infrastructure scaling and resource allocation decisions. By maintaining a continuous feedback loop, teams can ensure that the application evolves in alignment with user needs and performance benchmarks.
Conclusion
Integrating OpenTelemetry can greatly enhance observability in Go applications. This robust framework can help developers gain deeper insights into their application's behavior, ensuring optimal operation. The ability to trace requests, measure metrics and log events gives developers a comprehensive view of the application, aiding in both debugging and performance optimization.
It's recommended that Go developers consider integrating OpenTelemetry into their applications to ensure that they are performant and reliable. For more information, please refer to the OpenTelemetry official documentation for Go.

Ready to kick the tires?
Use code DEPLOYNOW for $300 credit