- Home /
- Resources /
- Learning center /
- Network Path Troub...
Network Path Troubleshooting Part Two - Windows, macOS, FreeBSD
Expand your network troubleshooting skills beyond Linux with this guide on diagnosing connectivity issues on Windows, macOS, and FreeBSD systems, detailing essential commands and techniques to ensure optimal network performance.

On this page
In the first part of this guide, we explained the networking debugging perspective from inside of an instance running in Equinix Metal. In most cases, such instances run a Linux operating system, although there is no strict technical requirement for that. They could just as well have Windows or other UNIX-based operating systems such as FreeBSD.
From our experience, though, we know that other, non-Linux operating systems are much more often to be found at the client side of things. And while in many cases, server-side misconfigurations are the root cause of a connectivity issue, the client side might be impacted by a technical issue or a misconfiguration as well. Hence, this second part of our networking debugging guide focuses on both the client side and the server side of things in environments that do not use Linux. Using three different operating systems, namely Windows, macOS and FreeBSD, we will show you the most common debugging steps and technologies.
As did the first guide on network debugging, this guide also serves as a tool that will help us to help you if you encounter problems while working with Equinix Metal. Supplying us with the information referenced in this document when contacting our customer success team will give us a lot of insight we need to assess the situation and reach a solution.
You Will Need
- Equinix Metal Account and a server as the source or destination of the network traffic you are testing.
- An Equinix Metal server running Windows Server (optional).
- A client machine running Windows. (optional)
- A client machine running macOS. (optional)
- A local BSD-based system. (optional)
Since this guide covers a few possibilities for your setup, you may only have one of the potential systems mentioned. Note that some tools may require root/sudo access to run.
Debugging Windows Server
If you are running Windows Server on Equinix Metal, getting information on your networking situation is a little different from a Linux server. Windows does not have mtr or equivalent command, and unfortunately, WSLv1 does not support mtr usage either. You can, however, get information on packet loss and latency from ping and latency and path from tracert.
ping
ping is an available command in cmd and PowerShell that sends and receives 4 packets, returning packet loss and total time statistics. When things are working relatively normally, pinging an external IP address from your server will look like:
Microsoft Windows [Version 10.0.17763.2565]
(c) 2018 Microsoft Corporation. All rights reserved.

C:\Users\Admin>ping 76.113.250.165

Pinging 76.113.250.165 with 32 bytes of data:
Reply from 76.113.250.165: bytes=32 time=40ms TTL=51
Reply from 76.113.250.165: bytes=32 time=39ms TTL=51
Reply from 76.113.250.165: bytes=32 time=39ms TTL=51
Reply from 76.113.250.165: bytes=32 time=39ms TTL=51

Ping statistics for 76.113.250.165:
    Packets: Sent = 4, Received = 4, Lost = 0 (0% loss),
Approximate round trip times in milli-seconds:
    Minimum = 39ms, Maximum = 40ms, Average = 39ms
And pinging your server from an external IP will look like:
Microsoft Windows [Version 10.0.19043.1526]
(c) Microsoft Corporation. All rights reserved.

C:\Users\User>ping 139.178.82.70

Pinging 139.178.82.70 with 32 bytes of data:
Reply from 139.178.82.70: bytes=32 time=40ms TTL=111
Reply from 139.178.82.70: bytes=32 time=40ms TTL=111
Reply from 139.178.82.70: bytes=32 time=40ms TTL=111
Reply from 139.178.82.70: bytes=32 time=42ms TTL=111

Ping statistics for 139.178.82.70:
    Packets: Sent = 4, Received = 4, Lost = 0 (0% loss),
Approximate round trip times in milli-seconds:
    Minimum = 40ms, Maximum = 42ms, Average = 40ms
ping only gives you total packet loss from source to destination and does not include any details on where on the path your traffic might be encountering problems. It is just a tool that will expose packet loss occurring between the source and destination.
tracert
If you need to dig down into which nodes your traffic is hitting, and whether those nodes are experiencing high latency, you can use tracert, also available in PowerShell.
C:\Users\Admin>tracert 76.113.250.165

Tracing route to c-76-113-250-165.hsd1.mn.comcast.net [76.113.250.165]
over a maximum of 30 hops:

  1    <1 ms    <1 ms    <1 ms  169.254.29.1
  2    <1 ms    <1 ms    <1 ms  10.253.57.204
  3     1 ms    <1 ms    <1 ms  10.253.56.9
  4     1 ms     1 ms     1 ms  dls-b22-link.ip.twelve99.net [62.115.176.218]
  5     *        *        *     Request timed out.
  6     *        *        *     Request timed out.
  7     1 ms     1 ms     1 ms  comcast-ic359572-dls-b23.ip.twelve99-cust.net [80.239.160.214]
  8     1 ms     1 ms     1 ms  be-3411-cs04.dallas.tx.ibone.comcast.net [96.110.34.93]
  9     2 ms     1 ms     1 ms  be-1412-cr12.dallas.tx.ibone.comcast.net [68.86.166.126]
 10    18 ms    18 ms    18 ms  be-302-cr12.1601milehigh.co.ibone.comcast.net [96.110.38.101]
 11    18 ms    19 ms    18 ms  be-1212-cs02.1601milehigh.co.ibone.comcast.net [96.110.39.85]
 12    34 ms    34 ms    34 ms  96.110.40.102
 13    34 ms    34 ms    34 ms  te-0-2-0-0-sur01.edina.mn.minn.comcast.net [69.139.176.210]
 14    34 ms    34 ms    34 ms  po-1-xar01.crosstown.mn.minn.comcast.net [68.86.232.206]
 15    34 ms    34 ms    34 ms  po-1-rur201.crosstown.mn.minn.comcast.net [68.87.175.14]
 16    35 ms    48 ms    39 ms  68.85.201.178
 17    40 ms    45 ms    38 ms  c-76-113-250-165.hsd1.mn.comcast.net [76.113.250.165]

Trace complete.
tracert traces the route from your source and destination, keeping track of the latency at each node. The latency is tracked by displaying the round-trip time for 3 TTL packets, which gives some sense of the consistency at each node of the route.
The return path is often different from the outgoing path, so it is useful to check both.
Microsoft Windows [Version 10.0.19043.1526]
(c) Microsoft Corporation. All rights reserved.

C:\Users\User>tracert 139.178.82.70

Tracing route to network-path-troubleshooting [139.178.82.70]
over a maximum of 30 hops:

  1    <1 ms    <1 ms    <1 ms  192.168.1.1
  2    41 ms    13 ms     8 ms  172.30.121.131
  3     7 ms     8 ms     8 ms  68.85.201.185
  4     7 ms     8 ms     8 ms  po-200-xar02.crosstown.mn.minn.comcast.net [68.86.233.185]
  5     9 ms    10 ms    14 ms  68.87.175.9
  6    10 ms    11 ms    10 ms  162.151.138.5
  7    19 ms    18 ms    20 ms  be-37041-cs04.350ecermak.il.ibone.comcast.net [96.110.43.13]
  8    20 ms    20 ms    29 ms  be-2411-pe11.350ecermak.il.ibone.comcast.net [96.110.33.206]
  9    23 ms    23 ms    21 ms  62.115.54.21
 10     *        *        *     Request timed out.
 11    39 ms    49 ms    40 ms  dls-b24-link.ip.twelve99.net [62.115.136.46]
 12    55 ms    40 ms    39 ms  packethost-ic346115-dls-b22.ip.twelve99-cust.net [62.115.176.219]
 13     *        *        *     Request timed out.
 14     *        *        *     Request timed out.
 15    39 ms    40 ms    40 ms  network-path-troubleshooting [139.178.82.70]

Trace complete.
Unfortunately, you do not get packet loss statistics from tracert. But now that you have the IP addresses along the path, you can ping each IP address to see where you may be experiencing packet loss.
This is not as convenient as the all-in-one picture available to Linux users through mtr, but can help you start to troubleshoot for issues in a similar manner.
Debugging Windows clients
If you encounter issues while connecting to your Equinix Metal instances from Windows clients, the good news is that debugging Windows clients works the same way that debugging Windows server instances works. Test whether you can reach the target IP in Equinix Metal from your client using tools such as ping and tracert. You get access to these tools by typing “cmd” into the search field of your Windows desktop, or by using PowerShell, installed by default on most modern Windows instances. Even if you do not have Administrator account access on your computer, most of these tools will still be available to you through “cmd”.
Please keep in mind that many Windows clients either use Microsoft Security Essentials or other personal firewall software to increase the level of protection of the device. If that is the case in your situation and you are not the administrator of your device, please consult with your administrator to see if the installed firewall is possibly causing issues.
Please also note that different bits of information on your system configuration may also be available through the graphical user interface on Windows client machines. For instance, your routing entries and your IP address can be found in the “TCP/IP” entry of the properties of your currently active network connection. You can also find information about the currently used DNS servers there, which might be causing an issue if you can reach certain hosts in Equinix Metal but not their corresponding DNS entries.
Debugging macOS clients
As macOS has not been available as a server operating system for quite a while now, most if not all problems associated with macOS will usually occur on clients. Being a desktop operating system, of course, most information can be gathered through the standard macOS UI. Let’s have a look at these first.
IP Configuration
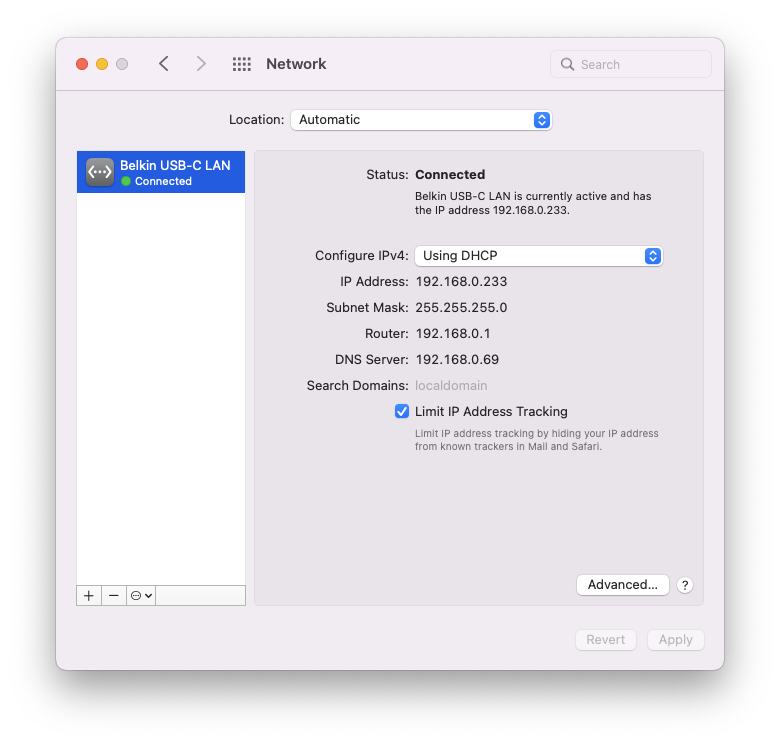
Open your System Preferences and click on “Network”. You will see a list of existing networking devices to your left.
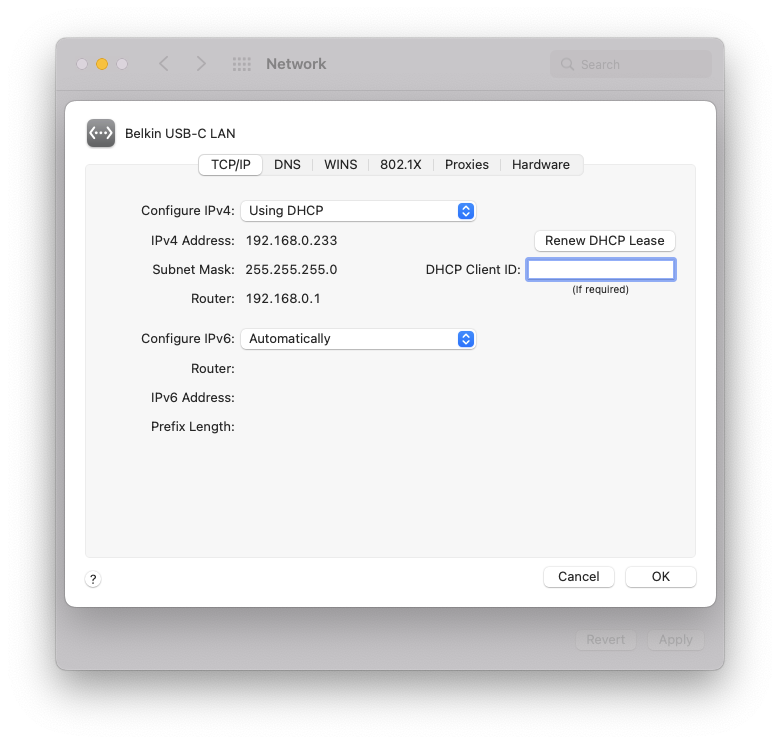
Select the currently active one (i.e. the one with a green dot below it) and click on “Advanced”. Select “TCP/IP”. Here, you can see what IPv4 and IPv6 addresses are currently assigned to your client.
To take a screenshot of the picture, press [control]+[shift]+[4] on your keyboard and hover with the pointer over the window. Press [Space]. The screenshot will be in your “Desktop” folder afterwards.
Alternatively, you can use the command line to get details about your macOS networking configuration. In Finder, click on “Go To / Utilities” and double-click on “Terminal”. Run ifconfig -a.
When opening a ticket with our customer success team, please be sure to either supply a screenshot of your network configuration or the output of ifconfig -a via Copy and Paste.
ping
To test your internet connectivity in general and your connection to an instance in Equinix Metal specifically, use the ping command on the command line.
mloschwitz@mbp ~$ ping -c 4 8.8.8.8
PING 8.8.8.8 (8.8.8.8): 56 data bytes
64 bytes from 8.8.8.8: icmp_seq=0 ttl=119 time=18.501 ms
64 bytes from 8.8.8.8: icmp_seq=1 ttl=119 time=15.090 ms
64 bytes from 8.8.8.8: icmp_seq=2 ttl=119 time=13.750 ms
64 bytes from 8.8.8.8: icmp_seq=3 ttl=119 time=14.305 ms

--- 8.8.8.8 ping statistics ---
4 packets transmitted, 4 packets received, 0.0% packet loss
round-trip min/avg/max/stddev = 13.750/15.412/18.501/1.846 ms
The example command will test internet connectivity to 8.8.8.8, which is one of Google's public DNS servers. Insert your Equinix Metal instance’s IP address here to test connectivity between your client and the instance. Be sure to include the output of the program when opening a ticket with our customer success team.
traceroute
Traceroute is available as a command on macOS systems out of the box. There is no graphical representation delivered for it by Apple, though, so you will have to resort to the command-line interface (i.e. the terminal).
In Finder, click on “Go To / Utilities” and double-click on “Terminal”. Run traceroute <target> and be sure to replace “target” with your target address, usually the address of your Equinix instance.
mloschwitz@mbp: ~$ traceroute 139.178.82.70
traceroute to 139.178.82.70 (139.178.82.70), 64 hops max, 52 byte packets
 1  speedport.ip (192.168.2.1)  9.062 ms  5.931 ms  3.295 ms
 2  p3e9bf1ac.dip0.t-ipconnect.de (62.155.241.172)  9.566 ms  8.038 ms  8.078 ms
 3  217.5.117.34 (217.5.117.34)  14.226 ms  14.545 ms  12.501 ms
 4  217.5.117.34 (217.5.117.34)  14.152 ms  12.571 ms  12.203 ms
 5  80.157.204.58 (80.157.204.58)  15.995 ms  16.515 ms  15.120 ms
 6  ae11.cr8-dal3.ip4.gtt.net (213.200.115.30)  135.016 ms  127.420 ms  128.161 ms
 7  ip4.gtt.net (74.199.177.14)  141.398 ms  125.649 ms  126.382 ms
 8  * * *
mtr
If you are looking for a more beautiful variant of the traceroute utility, the mtr utility exists for macOS through the Homebrew tools collection. To install Homebrew, please follow the instructions on the project’s website at https://brew.sh/. All brew commands need to be run on the macOS command line, and once Homebrew itself is installed, brew install mtr will install the more colorful and more convenient variant of traceroute. You may invoke it afterwards using mtr <address> where you replace “address” with either an IP address or the hostname you want to contact. Running mtr will require sudo privilege on your machine.
netstat
A connectivity problem might be indicative for an issue in your routing table. Routing tables unfortunately don’t have a graphical representation in macOS (like traceroute), hence you will have to resort to the command line for this one again.
In Finder, click on “Go To / Utilities” and double-click on “Terminal”. Run “netstat -r”. Please be sure to include the full output of that command in a reply to our customer success team (or in the original request when you open it).
mloschwitz@mbp ~$ netstat -r
Routing tables

Internet:
Destination        Gateway            Flags           Netif Expire
default            speedport.ip       UGScg             en0
127                localhost          UCS               lo0
localhost          localhost          UH                lo0
169.254            link#13            UCS               en0      !
192.168.2          link#13            UCS               en0      !
192.168.2.1/32     link#13            UCS               en0      !
FreeBSD
FreeBSD is a well-established, UNIX-based operating system and one of the big BSDs on the market (along with NetBSD and OpenBSD). It is often used on servers and sometimes on desktops. We are including this in this guide to demonstrate how network debugging might work on UNIX-based systems (and on other BSDs as well, possibly).
What comes in handy is many commands on FreeBSD are similar to the ones on macOS – given that the core of macOS, the Darwin operating system kernel, has FreeBSD roots, that makes sense.
IP Configuration
On servers and clients, the command to get an overview of your FreeBSD network configuration is ifconfig -a. When opening a ticket with our customer success team, please specify whether you are using FreeBSD on the Equinix Metal instance or on your local client and be sure to supply the output of ifconfig -a in your ticket.
ping
The ping command to check the reachability of remote hosts works exactly the same way it works on FreeBSD. ping 8.8.8.8 would check whether Google’s public DNS servers are reachable from the host where you run the command, and ping 139.178.82.70 would check the reachability of the IP address 139.178.82.70.
root@vserver1:~ # ping -c 4 139.178.82.70
PING 139.178.82.70 (139.178.82.70): 56 data bytes
64 bytes from 139.178.82.70: icmp_seq=0 ttl=128 time=135.466 ms
64 bytes from 139.178.82.70: icmp_seq=1 ttl=128 time=133.597 ms
64 bytes from 139.178.82.70: icmp_seq=2 ttl=128 time=135.923 ms
64 bytes from 139.178.82.70: icmp_seq=3 ttl=128 time=132.125 ms

--- 139.178.82.70 ping statistics ---
4 packets transmitted, 4 packets received, 0.0% packet loss
round-trip min/avg/max/stddev = 132.125/134.278/135.923/1.518 ms
traceroute
The functionality of the traceroute command is identical to the functionality of the same command on macOS. Open a command line and enter traceroute 139.178.82.70 to figure out the routing between the machine where you run the command and the target host.
mloschwitz@vserver1: ~$ traceroute 139.178.82.70
traceroute to 139.178.82.70 (139.178.82.70), 64 hops max, 40 byte packets
 1  speedport.ip (192.168.2.1)  10.062 ms  5.931 ms  3.295 ms
 2  p3e9bf1ac.dip0.t-ipconnect.de (62.155.241.172)  9.566 ms  8.038 ms  8.078 ms
 3  217.5.117.34 (217.5.117.34)  14.226 ms  14.545 ms  12.501 ms
 4  217.5.117.34 (217.5.117.34)  14.152 ms  12.571 ms  12.203 ms
 5  80.157.204.58 (80.157.204.58)  15.995 ms  16.515 ms  15.120 ms
 6  ae11.cr8-dal3.ip4.gtt.net (213.200.115.30)  135.016 ms  127.420 ms  128.161 ms
 7  ip4.gtt.net (74.199.177.14)  141.398 ms  125.649 ms  126.382 ms
 8  * * *
mtr
The mtr program is available on FreeBSD through the ports collection. Ensure that you have the ports collection installed on your system and go to the /usr/ports/net/mtr directory by opening a command line and running cd /usr/ports/net/mtr command. Then, run make install. Afterwards, mtr is available, requiring the same parameters it supports on macOS when installed using Homebrew or on Linux.
netstat
To get a list of all currently established routes on FreeBSD, use netstat -r inside a terminal window. When asked, please be sure to include these details in your ticket with support.
mloschwitz@vserver1:~ $ netstat -r
Routing tables

Internet:
Destination        Gateway            Flags     Netif Expire
default            prl-local-ns-serve UGS      vtnet0
10.211.55.0/24     link#1             U        vtnet0
freebsd-13.1-rc3-a link#1             UHS         lo0
localhost          link#2             UH          lo0

Internet6:
Destination        Gateway            Flags     Netif Expire
::/96              localhost          UGRS        lo0
default            fe80::21c:42ff:fe0 UG       vtnet0
localhost          link#2             UHS         lo0
::ffff:0.0.0.0/96  localhost          UGRS        lo0
fdb2:2c26:f4e4::/6 link#1             U        vtnet0
fdb2:2c26:f4e4:0:2 link#1             UHS         lo0
fe80::/10          localhost          UGRS        lo0
fe80::%vtnet0/64   link#1             U        vtnet0
fe80::21c:42ff:fe4 link#1             UHS         lo0
fe80::%lo0/64      link#2             U           lo0
fe80::1%lo0        link#2             UHS         lo0
ff02::/16          localhost          UGRS        lo0
You may also like
Dig deeper into similar topics in our archives
Configuring BGP with BIRD 2 on Equinix Metal
Set up BGP on your Equinix Metal server using BIRD 2, including IP configuration, installation, and neighbor setup to ensure robust routing capabilities between your server and the Equinix M...

Configuring BGP with FRR on an Equinix Metal Server
Establish a robust BGP configuration on your Equinix Metal server using FRR, including setting up network interfaces, installing and configuring FRR software, and ensuring secure and efficie...

Crosscloud VPN with WireGuard
Learn to establish secure VPN connections across cloud environments using WireGuard, including detailed setups for site-to-site tunnels and VPN gateways with NAT on Equinix Metal, enhancing...

Deploy Your First Server
Learn the essentials of deploying your first server with Equinix Metal. Set up your project & SSH keys, provision a server and connect it to the internet.

Ready to kick the tires?
Use code DEPLOYNOW for $300 credit