Learn By Doing: An Observability Best-Practices Tutorial
Instrument a demo app and implement an observability stack with OpenTelemetry, Prometheus and Grafana.

Observability is the practice of investigating the state and health of large-scale, distributed systems based on the internal interactions between system components. It allows you to assess a system's long-term stability by closely evaluating the external data generated by these components. With observability, you can quickly detect issues, troubleshoot problems and ensure your systems run smoothly.
In this article, you'll learn about observability best practices as you instrument a demo app and implement an observability stack with three different observability tools: OpenTelemetry, an open source framework for collecting telemetry data (traces, logs and metrics); Prometheus, a powerful tool for monitoring and alerting; and Grafana, a rich platform for visualizing data.
More on observability:
- How to Use OpenTelemetry for Observability in .NET Apps
- Harnessing OpenTelemetry in Golang to Improve Observability
- How to Improve Observability Using OpenTelemetry in Python
- Leveraging OpenTelemetry Tracing to Tune Our Rails Monolith
The Demo Microservices App
In this tutorial, you'll use a demo e-commerce app to showcase Kubernetes, Istio and gRPC. The app has ten microservices that each contain different functionalities and communicate over gRPC.
You'll deploy the app to a local Kubernetes cluster and instrument it to expose metrics from the frontend component. Then, you'll set up the OpenTelemetry Collector to store the metrics in a centralized source and deploy Prometheus to scrape the exposed metrics. Finally, you'll use Grafana to visualize the collected data.
You can deploy the demo e-commerce application locally using any local Kubernetes distribution, like minikube or kind. This tutorial uses kind.
Prerequisites
Before getting started, make sure you have the following:
- kind for running local Kubernetes clusters inside Docker containers (this tutorial uses kind version v0.19.0)
- kubectl, a command line interface (CLI) for interacting with Kubernetes clusters via the Kubernetes APIs
- Skaffold, a Google CLI tool for deploying the demo e-commerce app to kind (this guide uses Skaffold v2.12.0)
- Go for modifying the demo app's source code and managing external dependencies
- Helm for installing Prometheus and Grafana using the
kube-prometheus-stack.
Once all the tools are installed, you can deploy the app. To start, clone the repository to your local machine:
git clone https://github.com/GoogleCloudPlatform/microservices-demo/
Navigate into the project directory and create a kind cluster:
cd microservices-demo
kind create cluster
Once the cluster is created, use Skaffold to deploy the e-commerce app to the cluster:
skaffold run
Deploying the app for the first time can take twenty to thirty minutes. Once it's finished, you can check the running status of the pods to verify whether the deployment was successful:
kubectl get pods
If the pods are running as expected, you can forward a local port to the application to access it:
kubectl port-forward deployment/frontend 8080:8080
This command maps the localhost port 8080 to the demo app's 8080 port.
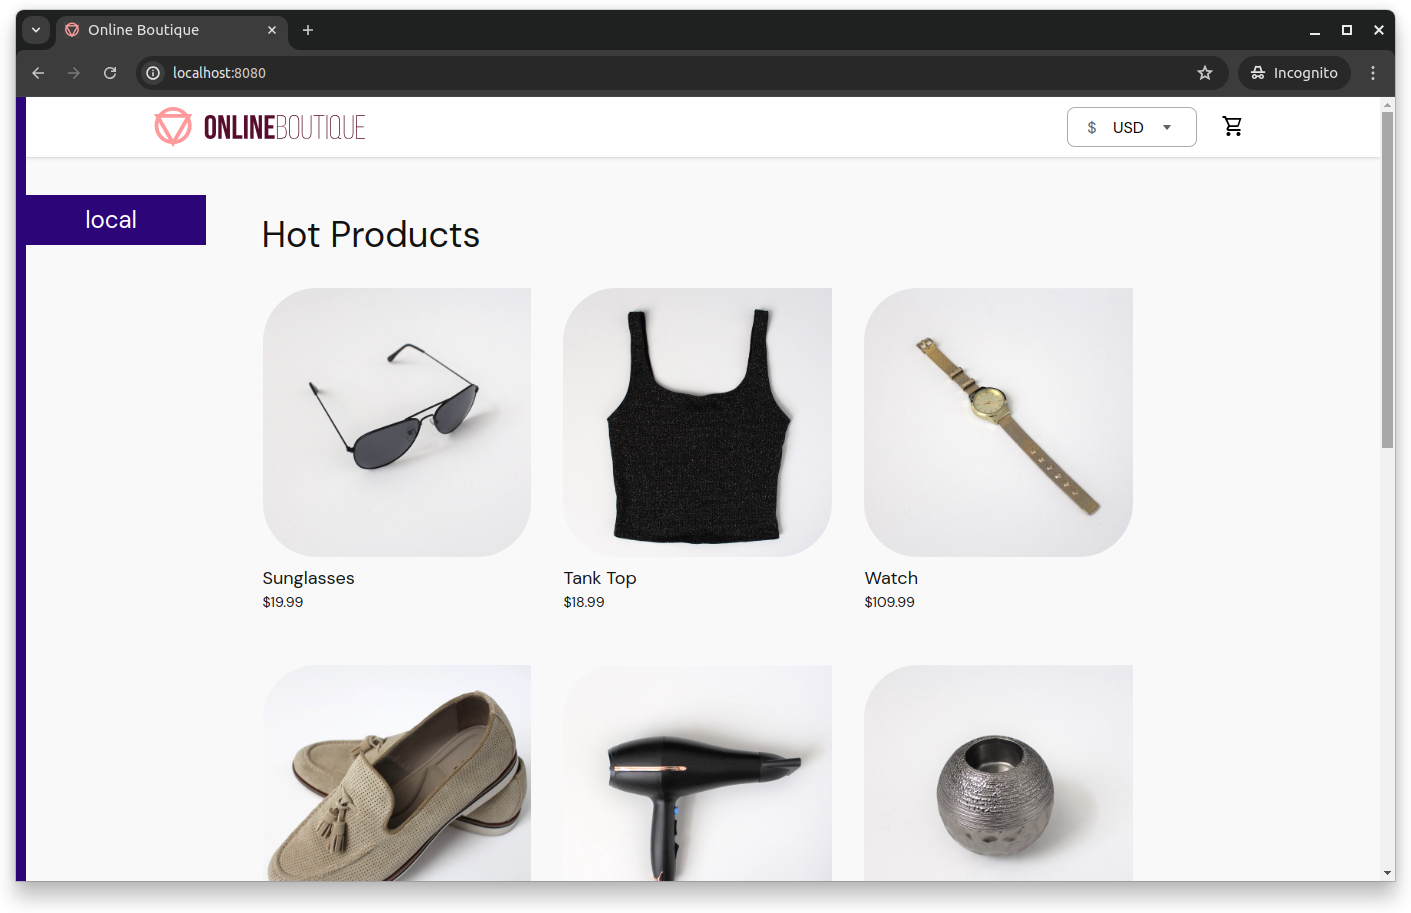
Next, visit https://localhost:8080 to access the running e-commerce app:
Planning for Observability
This tutorial focuses on observability best practices. To that end, in the following sections, you'll define three key metrics to collect from the demo app's frontend microservice.
1. Request Latency
Monitoring request latency is crucial as it directly affects user experience.
High latency can indicate performance bottlenecks, inefficient code or resource constraints. In an e-commerce application, slow response times can lead to cart abandonment and lost sales.
In this tutorial, you'll define frontend_request_latency_seconds as a Prometheus metric to measure the time it takes the frontend to process a request (that is, from when it is received to when a response is sent).
2. Error Rate
A high error rate often indicates bugs in the application, issues with external dependencies (such as payment gateways or inventory systems) or problems in the underlying infrastructure. Errors can lead to failed transactions and a poor user experience, which is especially detrimental in e-commerce.
Monitoring error rates lets you detect issues early and take corrective action before they impact your users. It also helps maintain the application's overall reliability and stability.
To monitor error rates in this tutorial, you'll define a frontend_error_rate_total metric that counts the total number of errors in your demo application.
3. Request Rate
Understanding the volume of incoming requests is crucial for gauging the load on your application and planning for capacity. It helps identify traffic patterns, peak usage times and potential distributed denial-of-service (DDoS) attacks.
Monitoring request rates allows you to scale your applications effectively to handle increased traffic. It also helps you ensure a smooth user experience during high-demand periods.
In this tutorial, you'll define a frontend_request_rate_total metric to track the total number of HTTP requests received by the frontend service.
Collecting and monitoring these three key metrics falls within observability best practices, as they provide an overall understanding of the demo application and help ensure a high-quality user experience, maintain system reliability and quickly address potential issues.
Instrumenting the Frontend Microservice
The demo app already has basic OpenTelemetry instrumentation in the frontend component. In this section, you'll learn how to instrument and expose the three metrics discussed previously so that Prometheus can collect them.
Using Prometheus in this observability stack makes sense for several reasons:
- Built-in alerting: The Prometheus Operator includes a built-in alerting component that can notify you of any issues in real time, helping you respond quickly to potential problems.
- Easy integration: Prometheus can easily collect metrics from Kubernetes clusters and correlate them with metrics from your apps and services. This provides a holistic view of your system's performance and health.
- Powerful querying: Prometheus supports a powerful querying language (PromQL) that allows you to effectively extract and analyze metrics data.
Add Prometheus Client Libraries
To instrument your frontend microservice, you'll need to install the Prometheus Go client libraries. Navigate to /src/frontend and install these libraries using the following go get commands:
go get github.com/prometheus/client_golang/prometheus
go get github.com/prometheus/client_golang/prometheus/promauto
go get github.com/prometheus/client_golang/prometheus/promhttp
Next, you need to define the three required metrics in the frontend microservice. To do this, navigate to src/frontend/main.go and add the following lines of code:
import (
	"github.com/prometheus/client_golang/prometheus"
	"github.com/prometheus/client_golang/prometheus/promauto"
	"github.com/prometheus/client_golang/prometheus/promhttp"
)
These lines import the necessary client libraries for Prometheus. Make sure you don't remove any other existing imports or code.
Then, add the following code snippet before the main function:
var (
	requestLatency = promauto.NewHistogram(prometheus.HistogramOpts{
		Name: "frontend_request_latency_seconds",
		Help: "Latency of HTTP requests in seconds",
	})
	errorRate = promauto.NewCounter(prometheus.CounterOpts{
		Name: "frontend_error_rate_total",
		Help: "Total number of errors",
	})
	requestRate = promauto.NewCounter(prometheus.CounterOpts{
		Name: "frontend_request_rate_total",
		Help: "Total number of HTTP requests",
	})
)
This snippet instruments the frontend microservice by defining the three metrics for Prometheus.
Modify the Handlers
For the previous metrics to record information in real time, you need to modify your frontend's handler functions. To register the metrics, edit the src/frontend/handlers.go file and replace the existing homeHandler handler definition with the following:
func (fe *frontendServer) homeHandler(w http.ResponseWriter, r *http.Request) {
	// Start timer to measure latency
	timer := prometheus.NewTimer(requestLatency)
	defer timer.ObserveDuration()

	// Increment the request rate counter
	requestRate.Inc()

	log := r.Context().Value(ctxKeyLog{}).(logrus.FieldLogger)
	log.WithField("currency", currentCurrency(r)).Info("home")
	currencies, err := fe.getCurrencies(r.Context())
	if err != nil {
		errorRate.Inc()
		renderHTTPError(log, r, w, errors.Wrap(err, "could not retrieve currencies"), http.StatusInternalServerError)
		return
	}
	products, err := fe.getProducts(r.Context())
	if err != nil {
		errorRate.Inc()
		renderHTTPError(log, r, w, errors.Wrap(err, "could not retrieve products"), http.StatusInternalServerError)
		return
	}
	cart, err := fe.getCart(r.Context(), sessionID(r))
	if err != nil {
		errorRate.Inc()
		renderHTTPError(log, r, w, errors.Wrap(err, "could not retrieve cart"), http.StatusInternalServerError)
		return
	}

	type productView struct {
		Item  *pb.Product
		Price *pb.Money
	}
	ps := make([]productView, len(products))
	for i, p := range products {
		price, err := fe.convertCurrency(r.Context(), p.GetPriceUsd(), currentCurrency(r))
		if err != nil {
			errorRate.Inc()
			renderHTTPError(log, r, w, errors.Wrapf(err, "failed to do currency conversion for product %s", p.GetId()), http.StatusInternalServerError)
			return
		}
		ps[i] = productView{p, price}
	}

	var env = os.Getenv("ENV_PLATFORM")
	if env == "" || stringinSlice(validEnvs, env) == false {
		fmt.Println("env platform is either empty or invalid")
		env = "local"
	}
	addrs, err := net.LookupHost("metadata.google.internal.")
	if err == nil && len(addrs) >= 0 {
		log.Debugf("Detected Google metadata server: %v, setting ENV_PLATFORM to GCP.", addrs)
		env = "gcp"
	}

	log.Debugf("ENV_PLATFORM is: %s", env)
	plat = platformDetails{}
	plat.setPlatformDetails(strings.ToLower(env))

	if err := templates.ExecuteTemplate(w, "home", injectCommonTemplateData(r, map[string]interface{}{
		"show_currency": true,
		"currencies":    currencies,
		"products":      ps,
		"cart_size":     cartSize(cart),
		"banner_color":  os.Getenv("BANNER_COLOR"), // Illustrates canary deployments
		"ad":            fe.chooseAd(r.Context(), []string{}, log),
	})); err != nil {
		log.Error(err)
	}
}
This registers the defined metrics in the handler logic. Save and close this file and run the following gofmt command to handle any formatting issues that might have occurred during editing:
gofmt -w handlers.go
Expose a Metrics Endpoint for Prometheus
Finally, you need to define a /metrics endpoint in the frontend component so Prometheus can gather metrics from there. Add the following line to your frontend's main.go function (below the other handlers):
r.Handle("/metrics", promhttp.Handler()) // Exposes Prometheus metrics
Test the Instrumentation
You can test if everything works by redeploying the e-commerce app using Skaffold:
cd microservices-demo
skaffold run
kubectl port-forward deployment/frontend 8080:8080
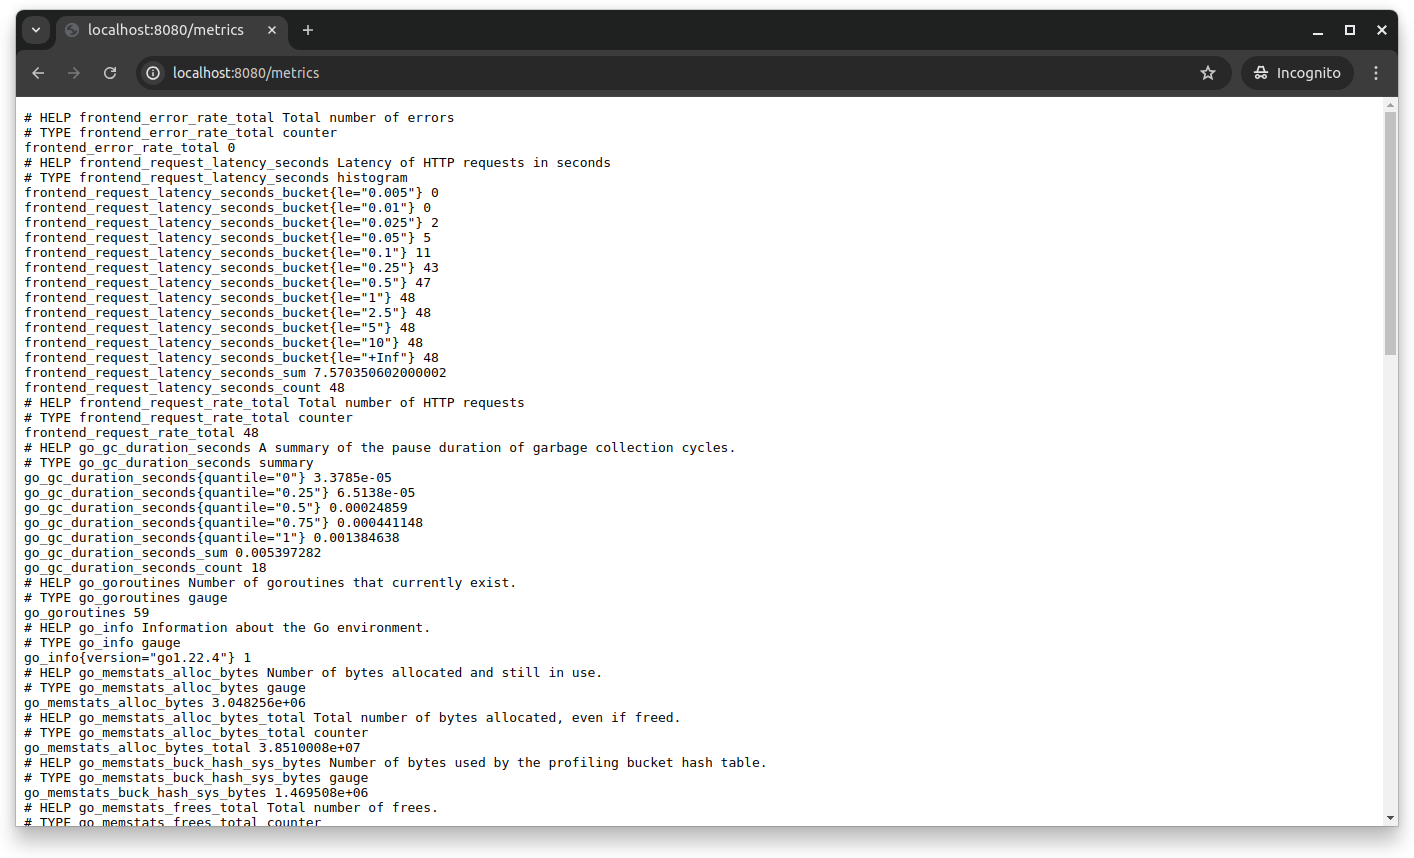
If you visit your browser's https://localhost:8080/metrics endpoint, you'll see the metrics Prometheus has collected. You can explore the Online Boutique app by going to different pages and products to register actual metrics.
Setting Up the OpenTelemetry Collector
In this section, you'll deploy and configure the OpenTelemetry Collector to work with Prometheus.
The OpenTelemetry Collector acts as a single point for collecting, processing and exporting telemetry data. This reduces the operational complexity of managing separate agents or exporters for metrics, logs and traces. By consolidating these functions, the OpenTelemetry Collector minimizes the need for multiple configurations and tools, making it easier to manage and maintain the observability stack.
The OpenTelemetry Collector also enhances interoperability by supporting various data sources and exporting telemetry data to multiple backend systems. This flexibility allows seamless integration with different tools and platforms.
Here, you'll deploy the OpenTelemetry Collector to your Kubernetes cluster. Then, the Collector retrieves metrics from your frontend service and re-exposes them for Prometheus to collect. This centralized approach helps manage and process telemetry data efficiently.
Deploy the OpenTelemetry Collector Configuration
The first thing you need to do is create the OpenTelemetry Collector configuration before creating the deployment, because the deployment stage depends on this configuration. Create a file called otel-collector-config.yaml in the project root (i.e. microservices-demo) and add the following code snippet:
apiVersion: v1
kind: ConfigMap
metadata:
  name: otel-collector-config
  namespace: default
data:
  otel-collector-config.yaml: |
    receivers:
      prometheus:
        config:
          scrape_configs:
            - job_name: 'frontend'
              scrape_interval: 10s
              static_configs:
                - targets: ['host.docker.internal:8080']
    processors:
      batch:
        send_batch_size: 10000
        timeout: 10s
    exporters:
      prometheus:
        endpoint: '0.0.0.0:9090'
        namespace: 'frontend'
        send_timestamps: true
      logging:
        verbosity: detailed
    service:
      pipelines:
        metrics:
          receivers: [prometheus]
          processors: [batch]
          exporters: [prometheus, logging]
This code sets up a Prometheus receiver to collect metrics from the frontend service at ten-second intervals. These metrics are then processed in batches of up to 10,000 with a timeout of ten seconds.
The configuration includes two exporters: a Prometheus exporter that exposes the metrics at 0.0.0.0:9090 under the frontend namespace, and a logging exporter for debugging.
Apply the ConfigMap to your kind cluster by running the following command:
kubectl apply -f otel-collector-config.yaml
Then, deploy the OpenTelemetry Collector to your kind cluster using the following deployment.
Create a file called otel-collector-deployment.yaml and add the following code, which specifies the required image name, mounts the volume containing the configuration created in the previous step and specifies the configuration file:
apiVersion: apps/v1
kind: Deployment
metadata:
  name: otel-collector
  namespace: default
spec:
  replicas: 1
  selector:
    matchLabels:
      app: otel-collector
  template:
    metadata:
      labels:
        app: otel-collector
    spec:
      containers:
        - name: otel-collector
          image: otel/opentelemetry-collector-contrib:latest
          volumeMounts:
            - name: otel-collector-config-vol
              mountPath: /etc/otelcol
              readOnly: true
          args: ["--config", "/etc/otelcol/otel-collector-config.yaml"]
      volumes:
        - name: otel-collector-config-vol
          configMap:
            name: otel-collector-config
Then, apply the deployment with this command:
kubectl apply -f otel-collector-deployment.yaml
Create a Service for OpenTelemetry
Next, you need to create a service that makes the OpenTelemetry Collector accessible within the Kubernetes cluster on port 9090.
Create a file called otel-collector-service.yaml and add the following code:
apiVersion: v1
kind: Service
metadata:
  name: otel-collector
  namespace: default
spec:
  ports:
    - port: 9090
      protocol: TCP
      targetPort: 9090
  selector:
    app: otel-collector
Apply the change by running the following:
kubectl apply -f otel-collector-service.yaml
Once you've set up the OpenTelemetry Collector to consolidate your telemetry data, you can check if everything works as expected by forwarding the otel-collector service to a new port on your local machine. To do that, open a new terminal and run the following command:
kubectl port-forward service/otel-collector 9090:9090
Visit the https://localhost:9090/metrics endpoint from your browser to verify the OpenTelemetry configuration:
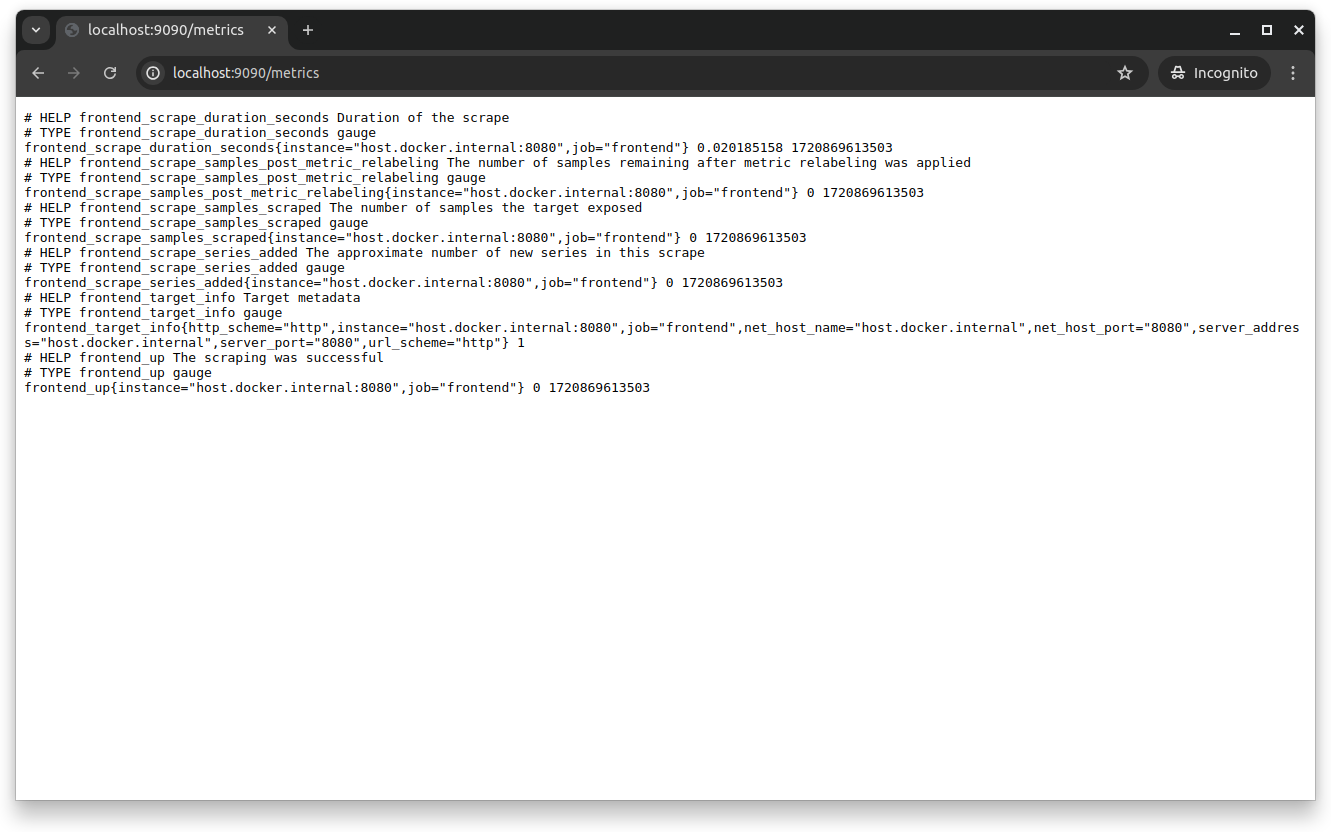
At this point, you've officially set up the OpenTelemetry Collector to collect metrics from your frontend service, process them in batches, export them to a Prometheus endpoint and log them for debugging. This setup centralizes your metrics collection and allows Prometheus to collect and monitor the metrics effectively.
Setting Up Prometheus Operator
This guide installs the Prometheus Operator using the popular kube-prometheus observability stack and configures it to scrape metrics from the frontend service.
Using the Prometheus Operator instead of manually installing it via YAML manifests simplifies the deployment and management of Prometheus instances and their components through Kubernetes custom resource definitions (CRDs). This approach aligns with DevOps and infrastructure as code (IaC) best principles since it allows configurations to be managed declaratively. Using CRDs, the Prometheus Operator ensures that all configurations are version-controlled, consistent and repeatable.
In addition, the Prometheus Operator automates many tasks (such as scaling, updates and management of Prometheus instances) that would otherwise require significant manual effort. This automation facilitates a more efficient and reliable observability stack that's capable of handling dynamic changes in the Kubernetes environment.
Deploy the Prometheus Operator
To deploy the Prometheus Operator, you need to add the Prometheus community Helm repository using the following code:
helm repo add prometheus-community https://prometheus-community.github.io/helm-charts
helm repo update
Install the Prometheus Operator through the kube-prometheus stack using the following command:
helm install prometheus-operator prometheus-community/kube-prometheus-stack
This command deploys the Prometheus Operator, including Prometheus, Alertmanager, Grafana and their respective CRDs.
Configure Prometheus to Collect Metrics from the Frontend Service
To configure Prometheus to collect metrics from the frontend service, create a ServiceMonitor in a file called frontend-servicemonitor.yaml using the following content:
apiVersion: monitoring.coreos.com/v1
kind: ServiceMonitor
metadata:
  name: frontend-servicemonitor
  labels:
    release: prometheus-operator
spec:
  selector:
    matchLabels:
      app: frontend
  endpoints:
    - port: http
      path: /metrics
      interval: 30s
This configuration tells Prometheus to collect from the /metrics endpoint of services labeled app: frontend every thirty seconds. Apply the ServiceMonitor using the following command:
kubectl apply -f frontend-servicemonitor.yaml
Open a new terminal and start the following port forward to visit the Prometheus metrics:
kubectl port-forward svc/prometheus-operator-kube-p-prometheus 9090:9090
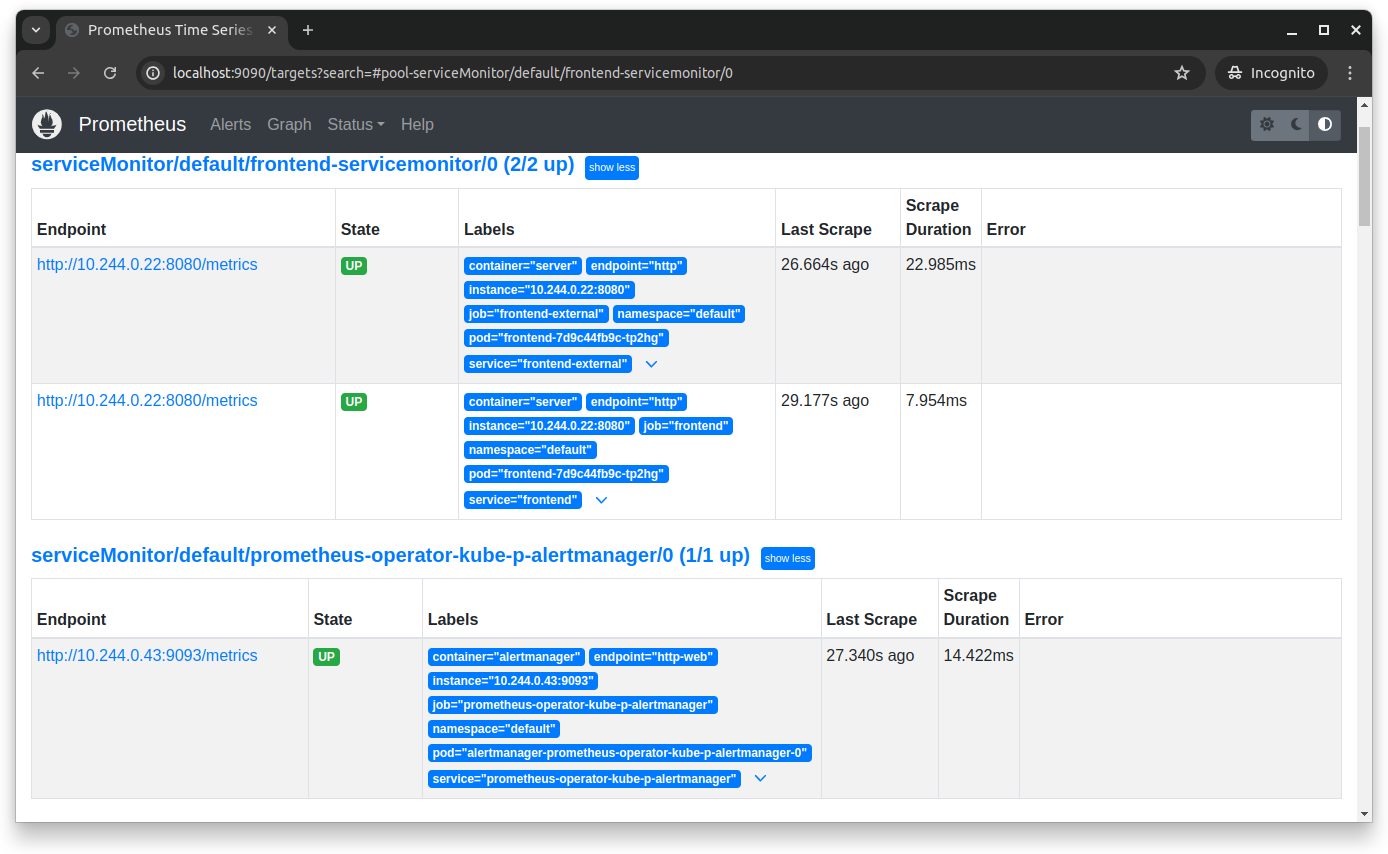
You can now visit the metrics collected by Prometheus by going to https://localhost:9090/targets in your browser:
Setting Up Grafana
Grafana is a critical component of observability as it provides powerful visualization and monitoring capabilities. It allows real-time monitoring of metrics, logs and traces, offering deep insights into your applications' performance and health. With Grafana, you can create custom dashboards, set up alerts for early detection of issues and monitor abnormal behavior and bottlenecks.
Since the kube-prometheus-stack Helm chart also installs Grafana, you don't need to install it manually. You can directly configure it to visualize metrics, logs and traces collected by Prometheus and the OpenTelemetry Collector.
Access Grafana and Set Up a Dashboard
To access the Grafana UI, you need to do a port forward from another terminal:
kubectl port-forward svc/prometheus-operator-grafana -n default 3000:80
Then, open your web browser and navigate to https://localhost:3000. Log in with the username admin and the password prom-operator.
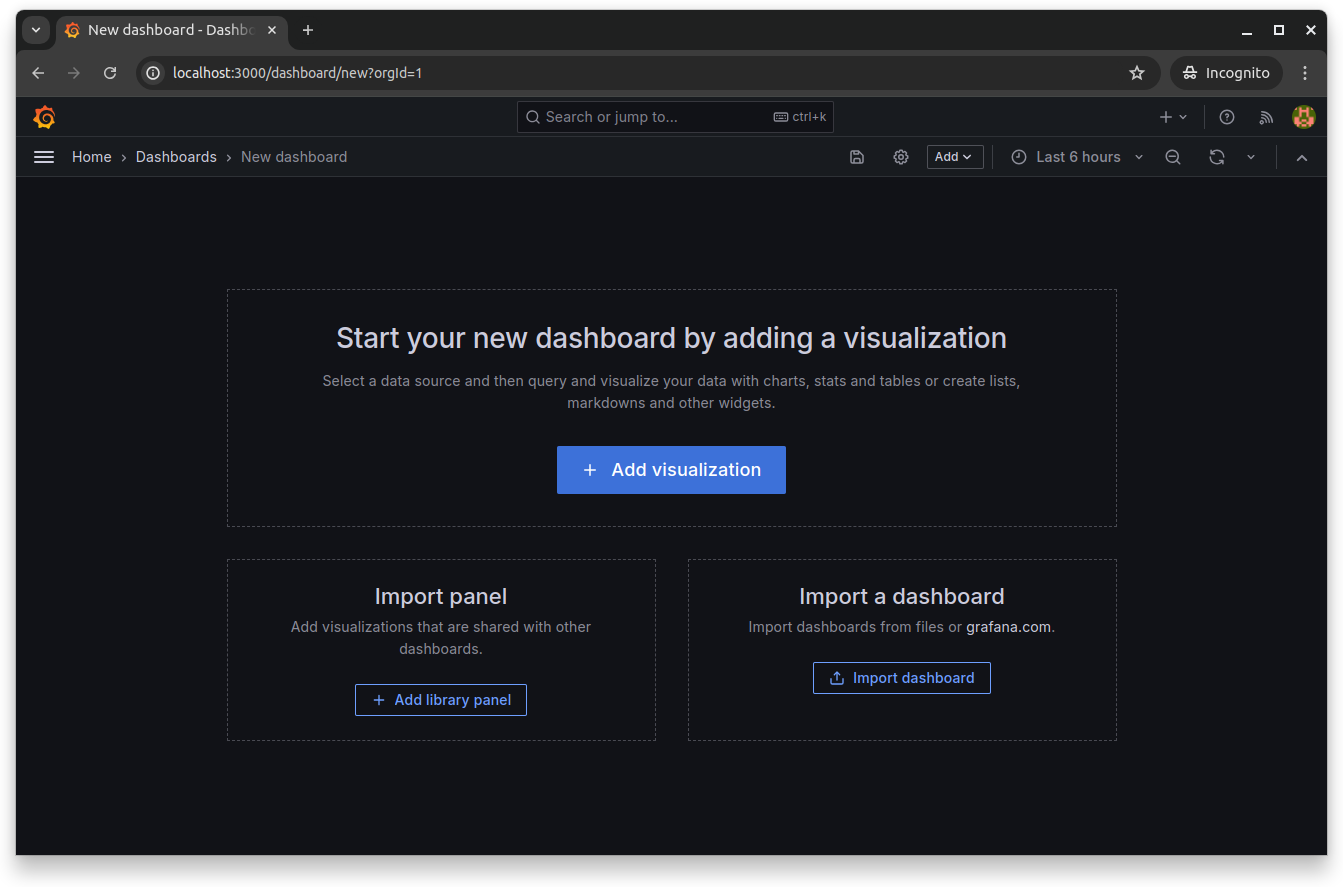
Since you installed Prometheus and Grafana using the kube-prometheus operator, it automatically provisions the Prometheus data source (typically named Prometheus). You can create a new Grafana dashboard by clicking Dashboards > New > New dashboard:
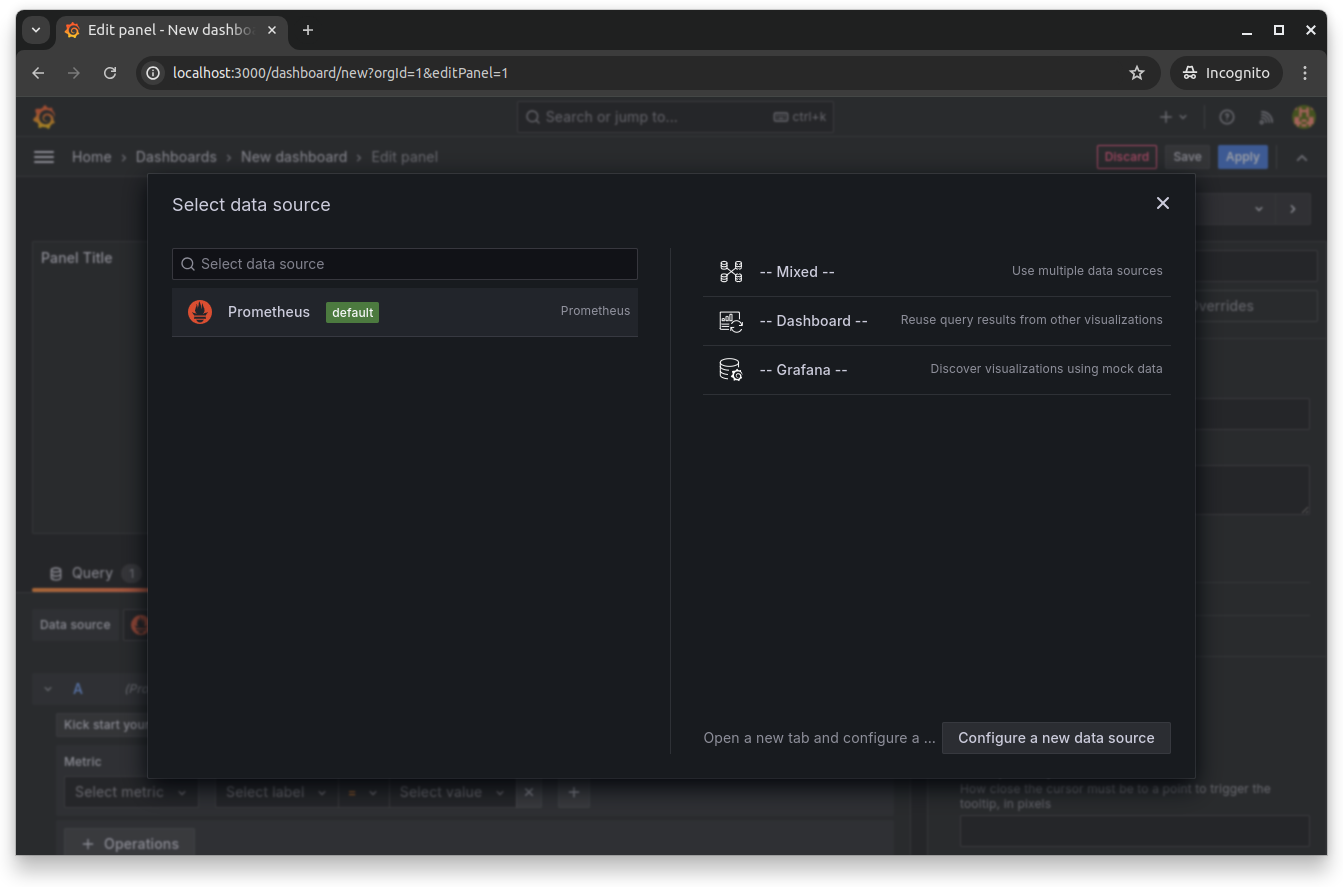
Click Add visualization and then select the Prometheus data source:
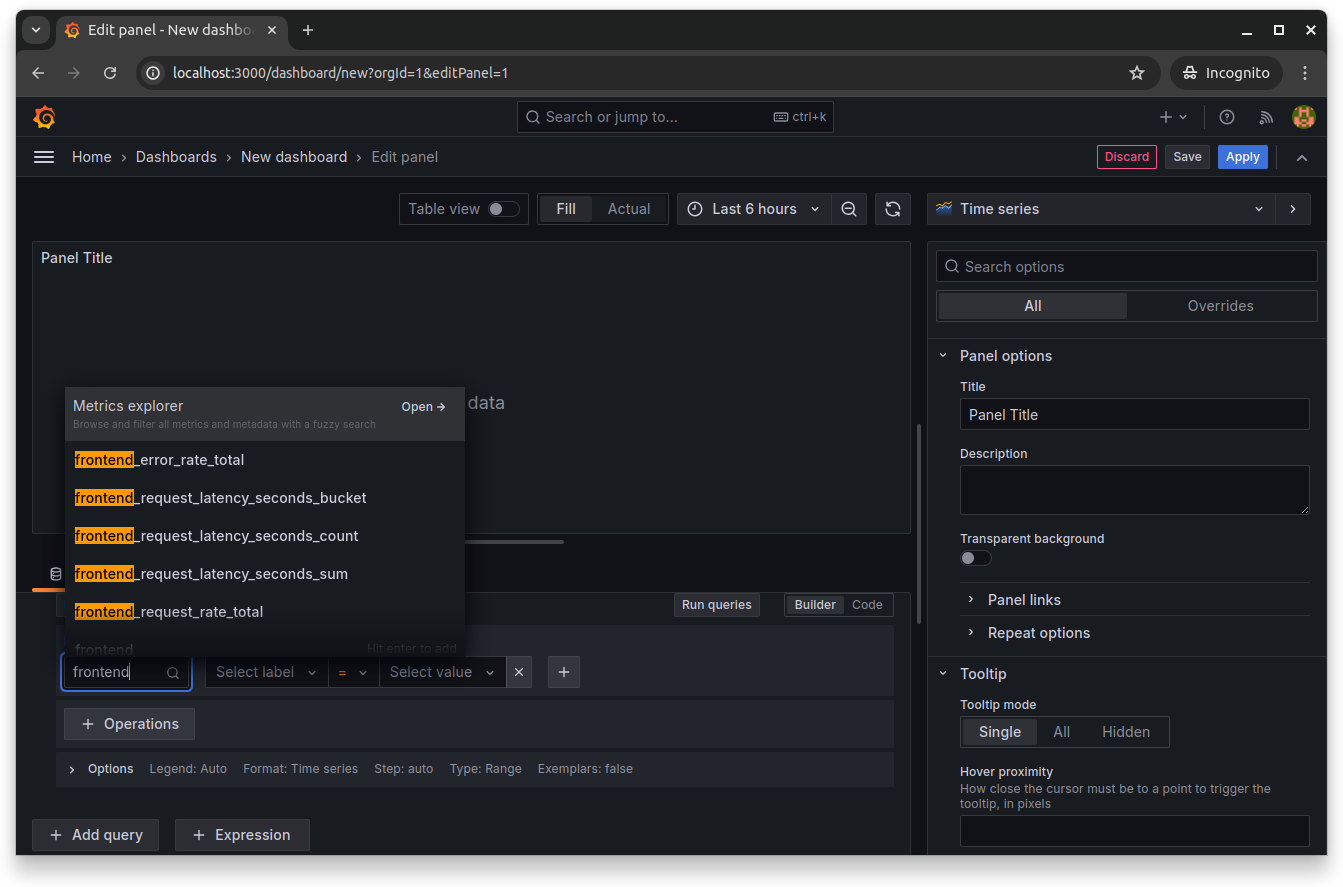
This opens the dashboard's panel editor, where you can choose the available frontend metrics and run queries on them. Select any frontend metrics by searching for them in the Metrics explorer:
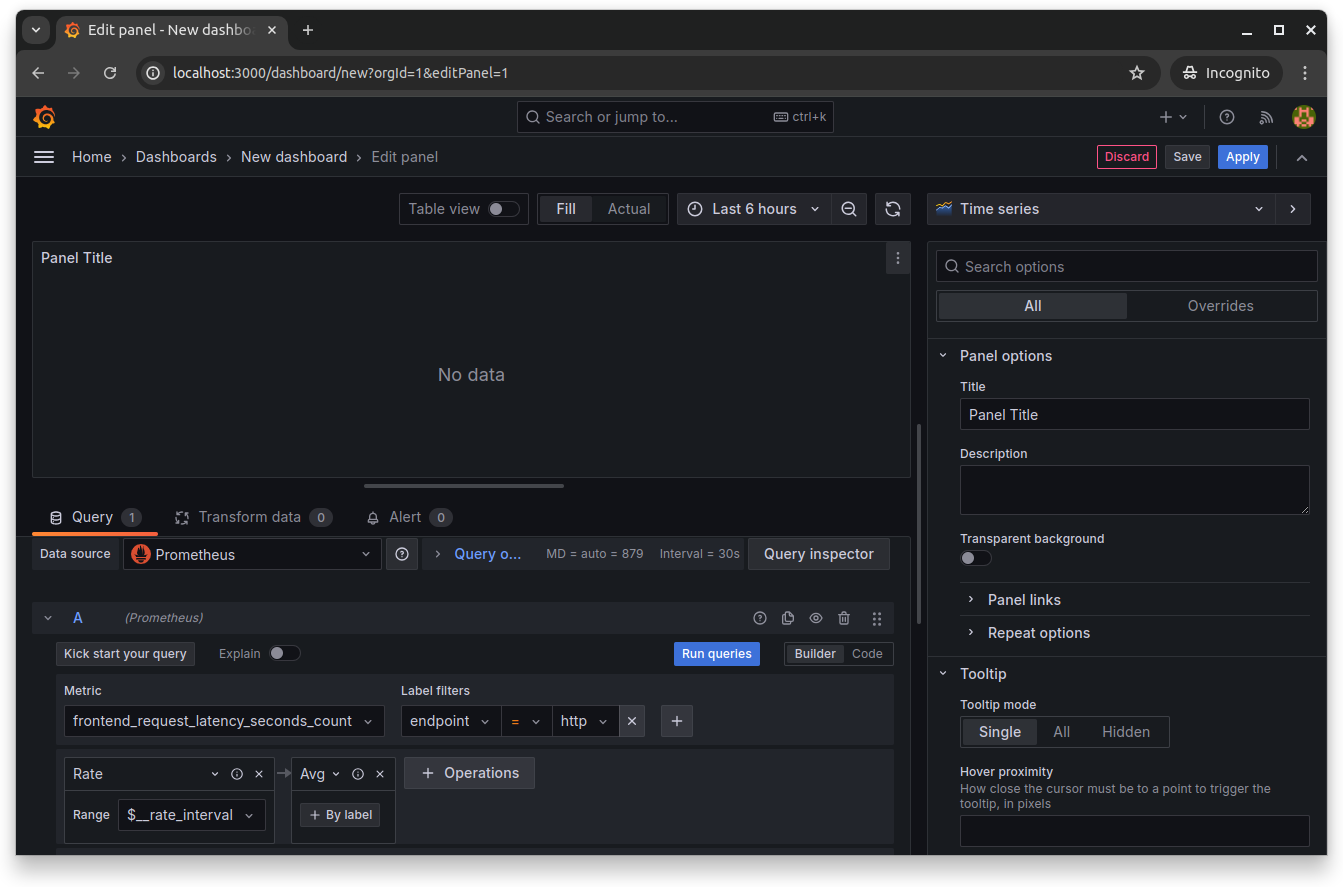
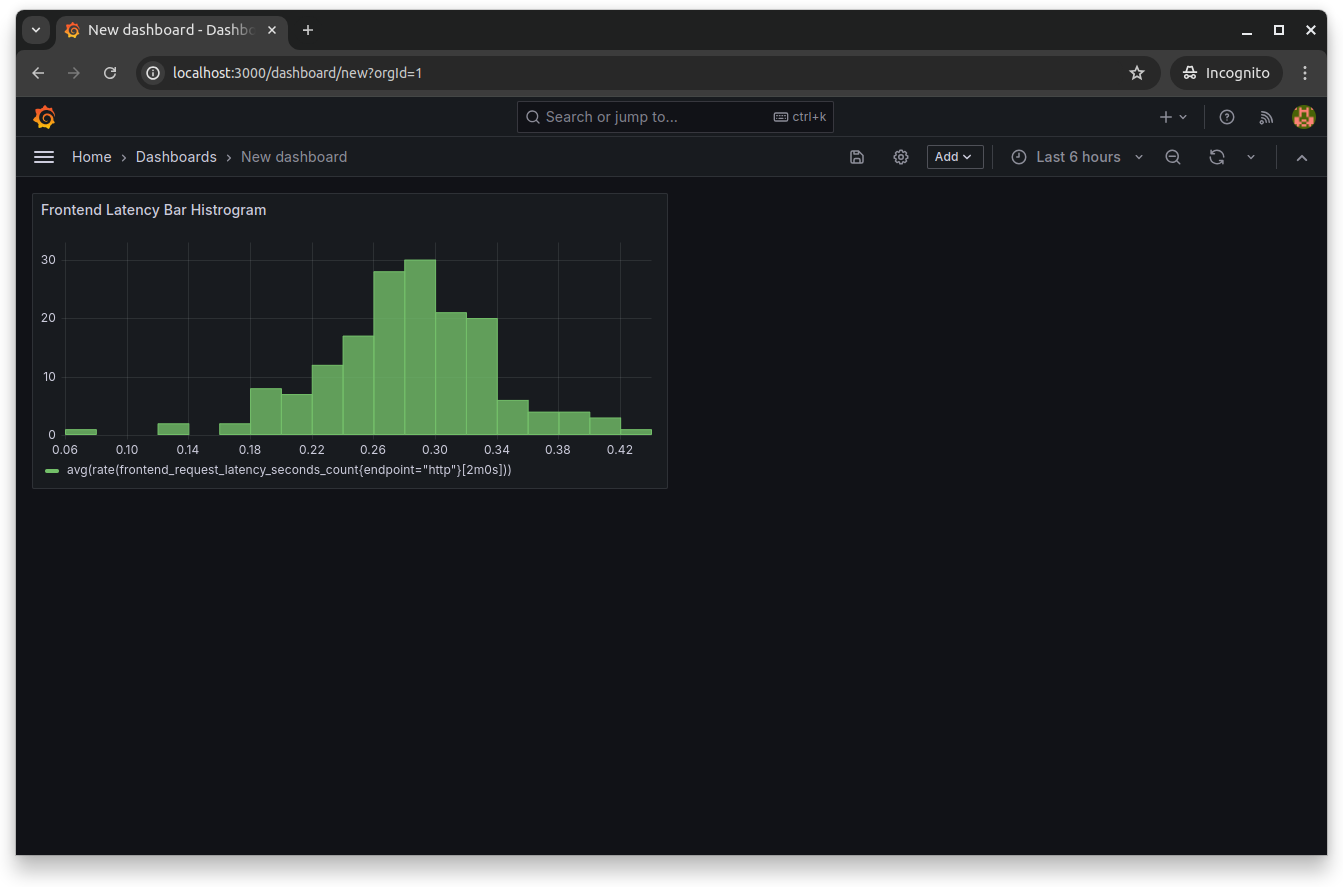
Set endpoint as the label and http as the label filter. Then, select operations like Rate and arguments like $__rate_interval, and click Run queries to run the specified query. This populates the dashboard with data for that query:
Click Save to save and close the Grafana dashboard editor:
Set Up Alerts
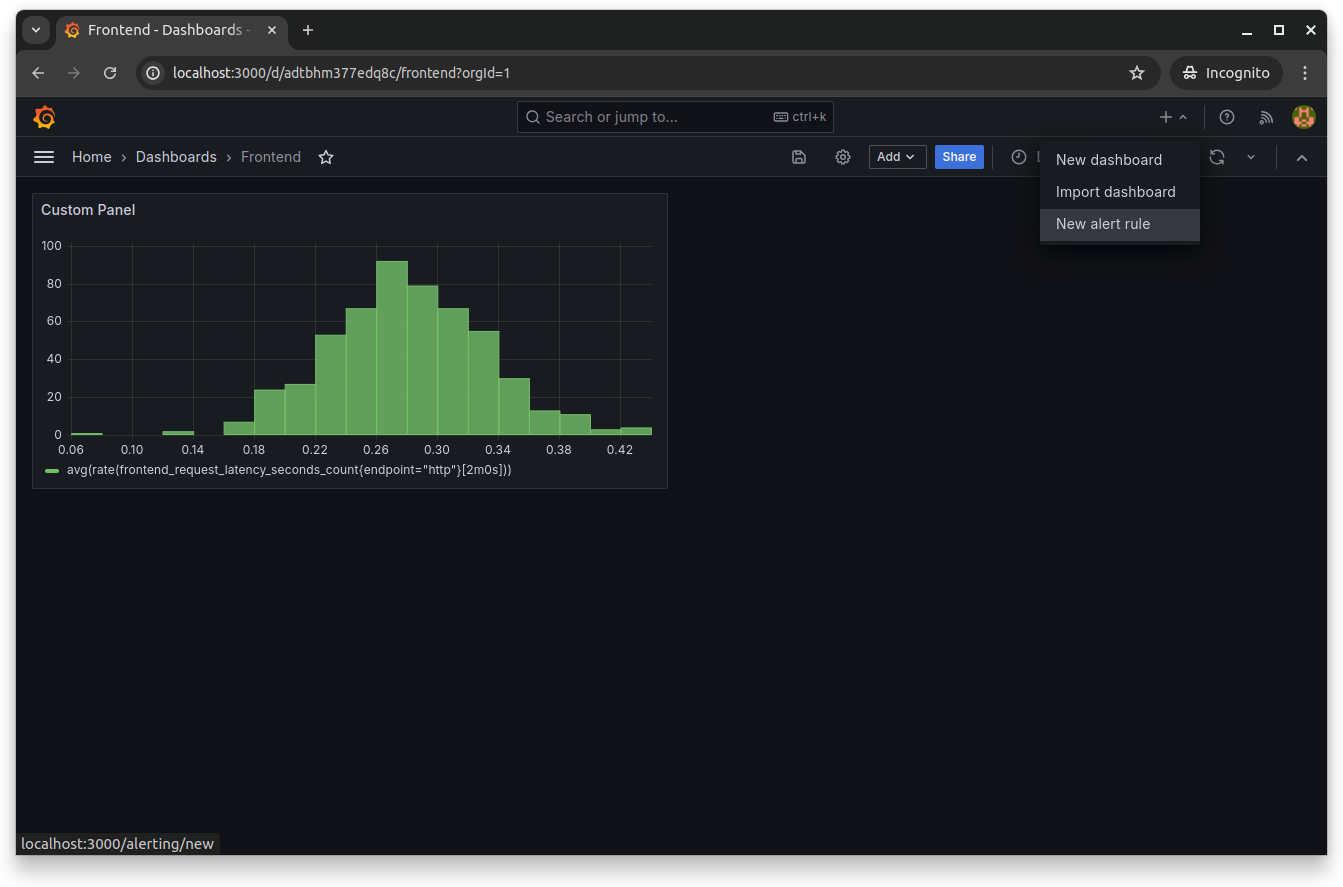
Setting up alerts in Grafana is essential for proactive monitoring of your application's health. You can do this by going to the panel editor and selecting New alert rule from the top menu:
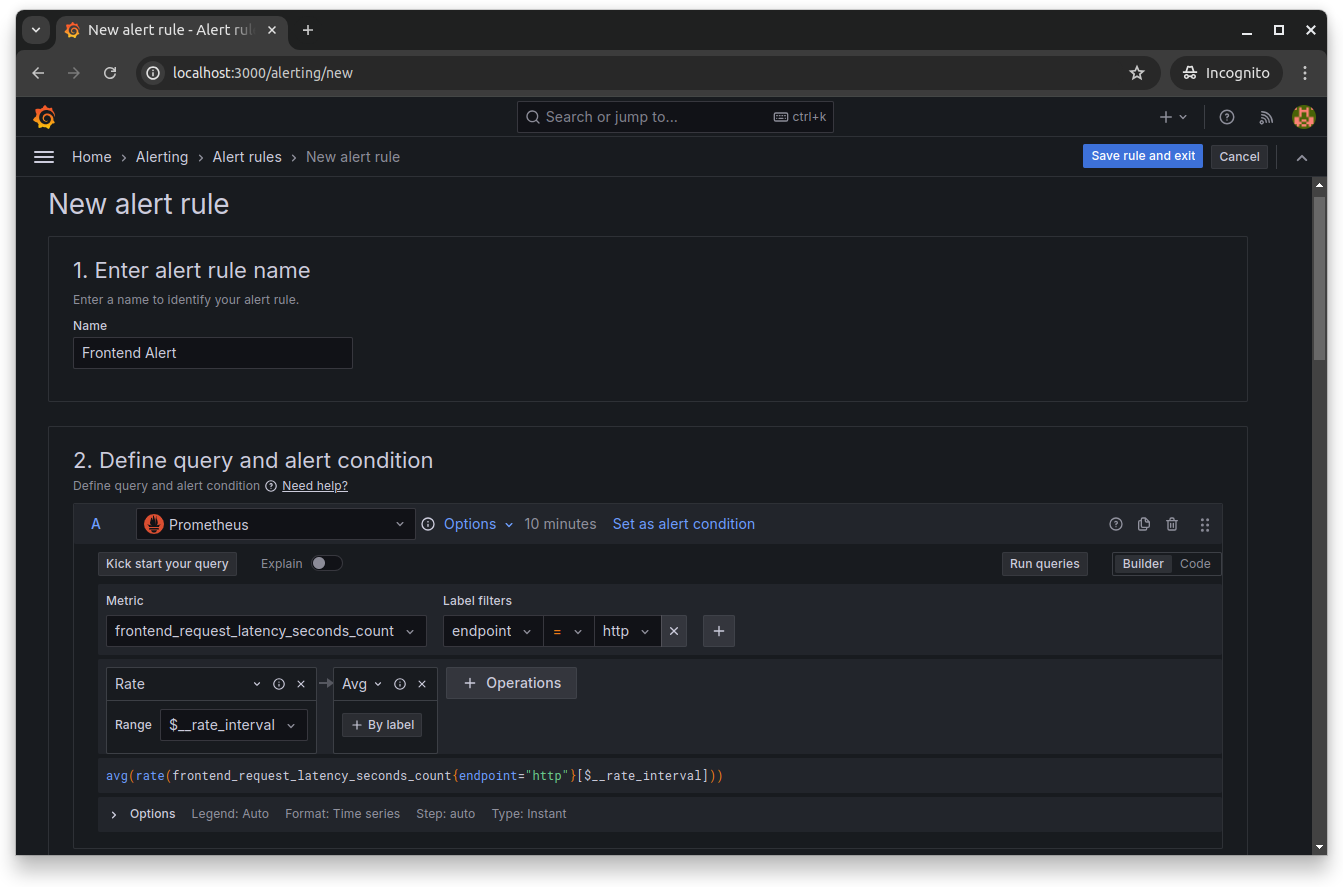
You'll need to give the alert rule a name and set the query and its alert condition. You can set the query by choosing the required metrics from the Metrics explorer and selecting the necessary labels, filters and operations:
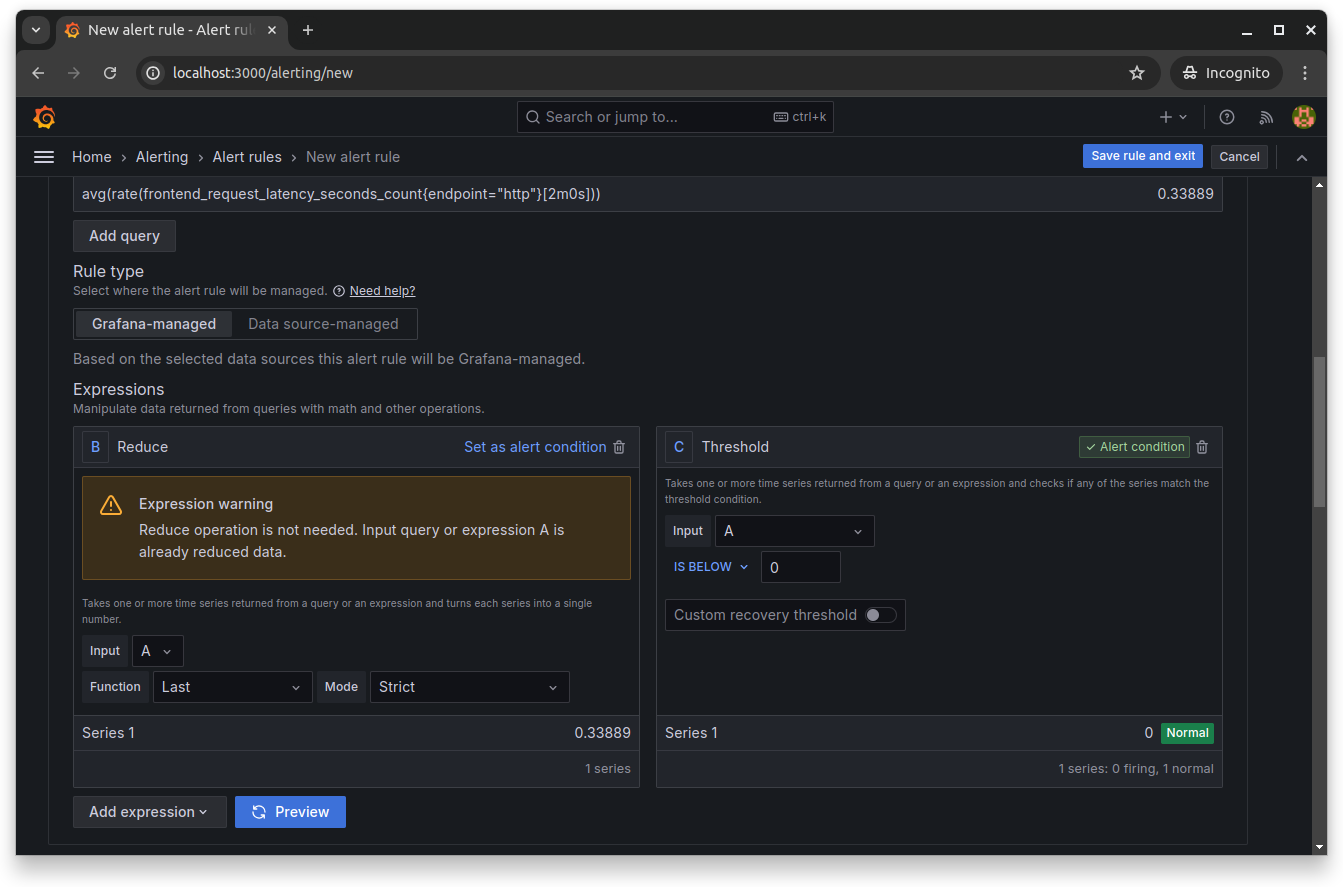
Scroll down and set the Reduce and Threshold expressions. These expressions allow you to manipulate data returned from queries using mathematical operations:
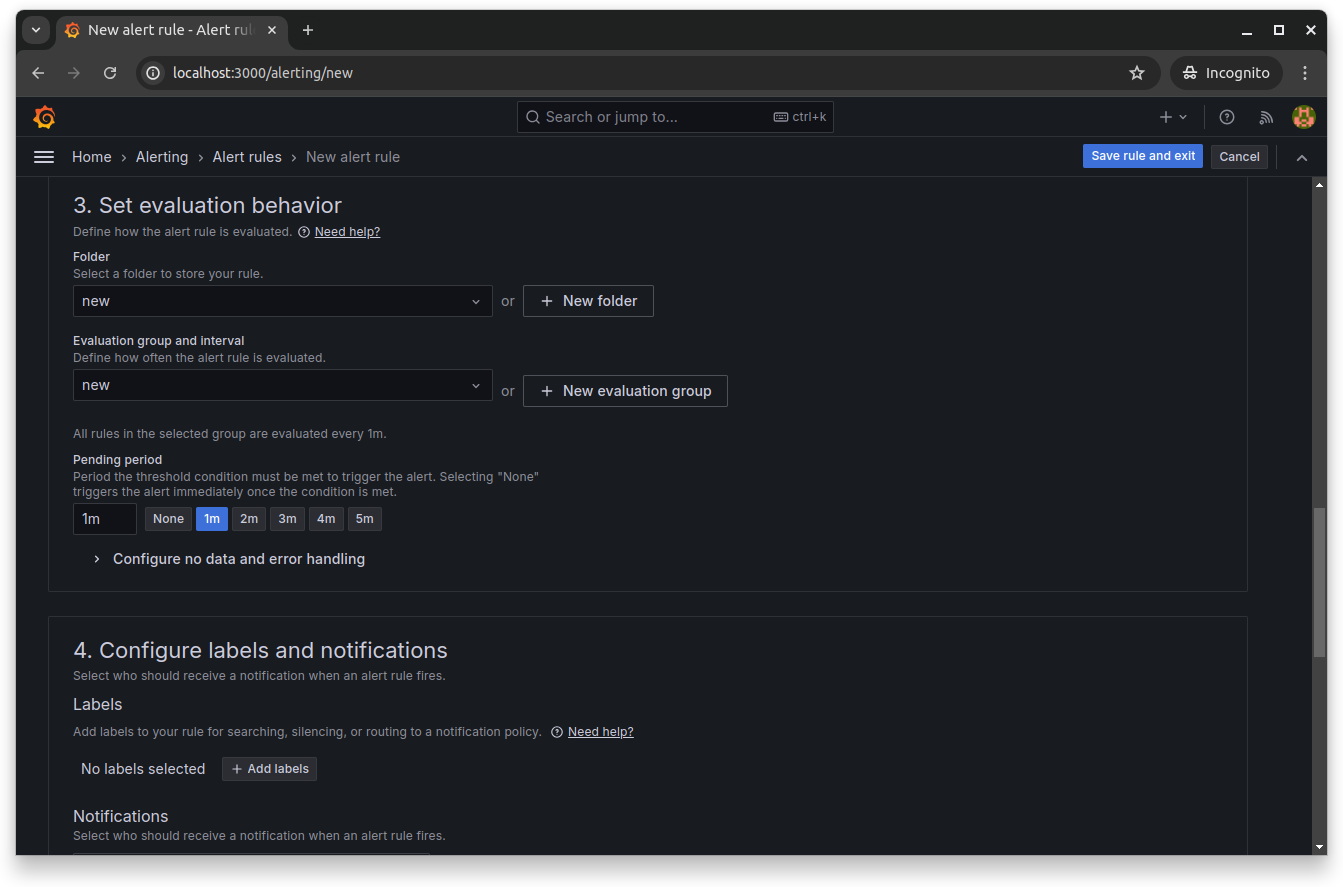
Next, scroll down and define the evaluation behavior of your rule. You'll set the folder name that contains the rules, as well as the evaluation group and period for this rule:
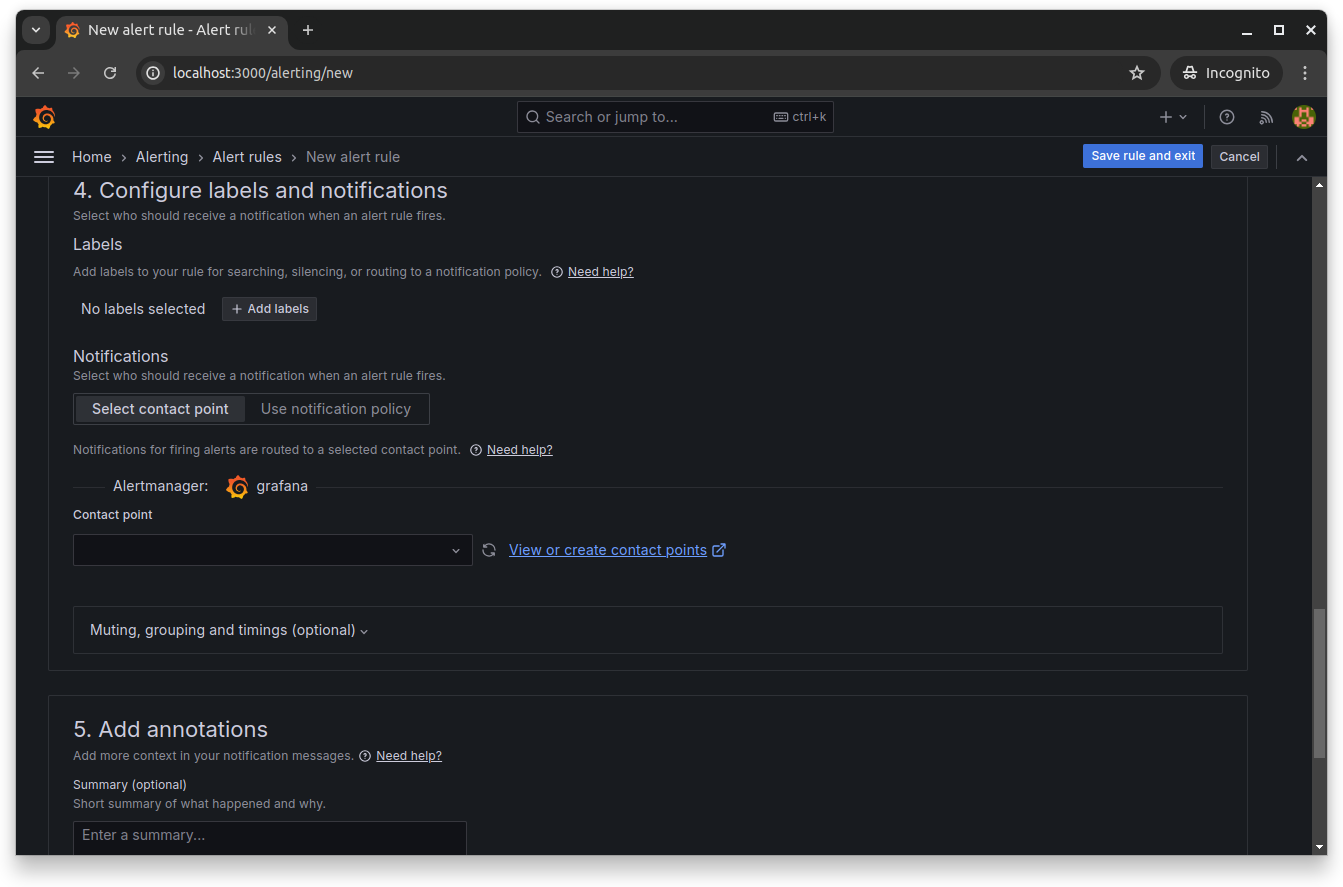
Finally, configure the labels and notifications to set who should be notified by Grafana when the alert fires. From the next section, you can also add annotations to add more context to your notification messages:
Click Save rule to enable and save the new Grafana alert rule.
Alerts enable you to detect issues before they escalate into major problems. For instance, if response times increase or error rates spike, alerts can notify you immediately, allowing you to take corrective actions quickly.
Conclusion
This tutorial taught you how to set up a comprehensive observability stack using Prometheus, OpenTelemetry Collector and Grafana. You started by instrumenting the frontend microservice to expose metrics. You then configured the OpenTelemetry Collector to gather and process these metrics and used Prometheus to collect and store them. Finally, you integrated Grafana to visualize the metrics, set up dashboards and create alerts for proactive monitoring. Following the observability best practices for DevOps engineers, this stack provides a robust solution for monitoring the performance and health of your applications in real time.