How to Use OpenTelemetry for Observability in .NET Apps
Holistic observability is a must in enterprise-grade cloud native applications. Here’s how to get it using the comprehensive OpenTelemetry framework.

If you’re building enterprise-grade applications, there’s a good chance you’re using Microsoft’s .NET framework. While there are already some powerful reliability, monitoring and performance optimization features in the framework and in the tools built for it, a modern distributed cloud-native application will benefit from being instrumented for holistic observability via OpenTelemetry.
An open source observability framework, OTel helps keep a close eye on your system by collecting, analyzing and exporting telemetry data. The project is part of the Cloud Native Computing Foundation (CNCF) and includes software development kits for numerous programming languages and frameworks including .NET.
In this article, you'll learn all about the OpenTelemetry .NET SDK and an example showing how to implement it in an existing ASP.NET Core application written in C#.
How OpenTelemetry Works
OpenTelemetry offers APIs and SDKs for seamless application integration and capturing instrumentation signals. These signals are then transmitted to the OpenTelemetry Collector, a crucial component of the framework.
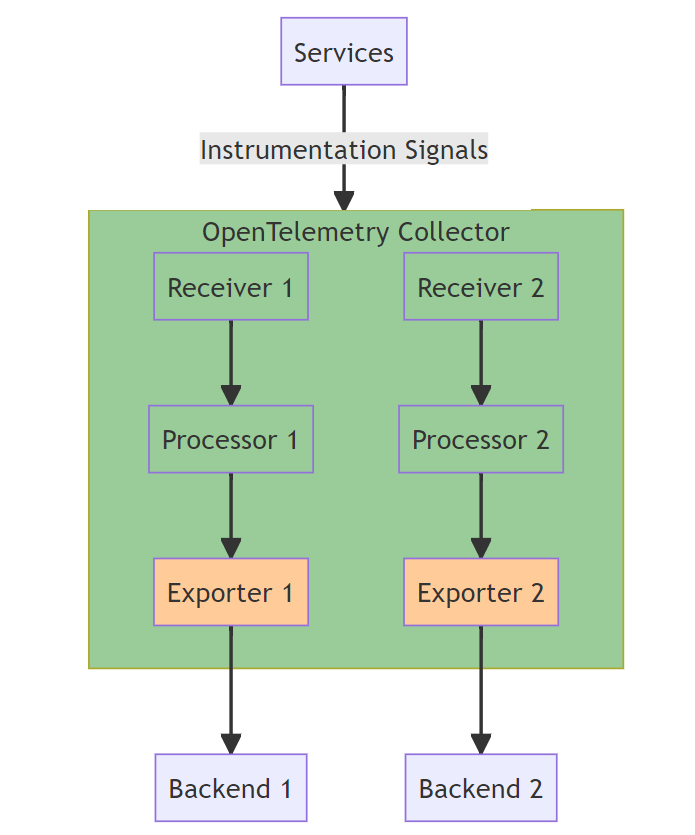
The collector receives, processes and exports telemetry data. It consists of “receivers,” “processors” and “exporters:”
- Receivers receive instrumentation data from various sources, including application services, HttpClients, gRPC and SQL.
- Processors receive data from receivers and apply transformations, like filtering, batching or enriching with additional data elements. (OpenTelemetry recommends using only certain processors.)
- Exporters send the processed data to various backends for storage, analysis and visualization.
Backends are the systems that receive data from OpenTelemetry, such as Prometheus, Zipkin and Grafana.
OpenTelemetry Signals
OpenTelemetry emits three types of signals:
- Traces represent the full lifespan of a request within your application. They are identified using a
TraceIdand consist of spans identified by aSpanId. Spans are single operations within a specific trace. - Metrics are units of measurement used during runtime. They can describe a variety of service aspects, including availability and request count.
- Logs are time-stamped text records with metadata. They convey information like errors, warnings and debugging events. A log is represented in OpenTelemetry by a `LogRecord`, which is a structured log with additional metadata, including
TraceId,SpanIdand attributes.
The OpenTelemetry .NET SDK
OpenTelemetry defines a set of APIs for signal formats like span, attributes and metric values. However, it doesn't specify how to sample or export these signals. These types of APIs are called no-op implementations. OpenTelemetry SDKs replace these APIs with concrete implementations that provide the actual functionality for sampling and exporting. In the next section, you'll learn how to add the OpenTelemetry .NET SDK to an existing .NET project and inspect the resulting logs, metrics and traces.
Add the Necessary NuGet Packages
To use OpenTelemetry with ASP.NET Core 6.0, you need a few NuGet packages in the OpenTelemetry.WebApi project. To obtain these packages, right-click on the OpenTelemetry.WebApi project in your development environment and click on Manage NuGet Packages.
Make sure you're in the Browse tab and select Include prerelease. (Some of these packages are still in the preview mode.)
In the search box, type "OpenTelemetry.Extensions.Hosting" and click Install. This adds the necessary extension methods to OpenTelemetry using dependency injection in ASP.NET Core.
Then in the search box, type "OpenTelemetry.Exporter.Console" and click Install. This installs the console exporter, enabling you to output the signals to the Console.
Repeat the same actions for "OpenTelemetry.Instrumentation.AspNetCore", which lets you capture signals from the ASP.NET Core infrastructure, and "OpenTelemetry.Instrumentation.Http", which lets you capture signals from the HttpClient in .NET.
Configure OpenTelemetry in Program.cs
Now let’s make some changes to the Program.cs file.
At the top of the file, add the following using statements:
using OpenTelemetry.Logs;
using OpenTelemetry.Metrics;
using OpenTelemetry.Resources;
using OpenTelemetry.Trace;
Then between the line containing builder.Services.AddHttpClient(); and the line containing var app = builder.Build();, add the following code:
// Open Telemetry logging
builder.Logging.AddOpenTelemetry(options =>
    {
        options.IncludeFormattedMessage = true;
        options.AddConsoleExporter();
    });
//Open Telemetry metrics
builder.Services.AddOpenTelemetry()
    .ConfigureResource(builder => builder
        .AddService(serviceName: "OpenTelemetryWebApiService"))
    .WithMetrics(builder => builder
        .AddAspNetCoreInstrumentation()
        .AddHttpClientInstrumentation()
        .AddConsoleExporter((exporterOptions, metricReaderOptions) =>
        {
            metricReaderOptions.PeriodicExportingMetricReaderOptions.ExportIntervalMilliseconds = 30000;
        })
    );
//Open Telemetry tracing
builder.Services.AddOpenTelemetry()
    .WithTracing(tracing => tracing
        .AddAspNetCoreInstrumentation()
        .AddHttpClientInstrumentation()
        .AddConsoleExporter());
Each block is responsible for configuring a different aspect of OpenTelemetry: logging, metrics and tracing. Together, they provide a comprehensive telemetry solution for monitoring and debugging your application.
Your application is now ready to emit logs, traces and metrics to the configured console backend using the console exporter.
Best Practices for Leveraging OpenTelemetry in .NET
There are some best practices you can follow to optimize your experience with OpenTelemetry in a C# environment:
Use Automatic Instrumentation
Use auto instrumentation to capture traces and metrics from your applications to avoid manual code modifications. This requires .NET Framework version 4.6.2 or newer. You also need to run the specific installation script for your operating system.
Adopt Semantic Conventions
Establish a standardized naming schema through semantic conventions to streamline data analysis and ensure consistency across your telemetry data.
Monitor OpenTelemetry Performance
Vigilantly monitor the impact of OpenTelemetry on your application’s performance. It can add latency or another kind of performance degradation.
Additionally, consider using batching to improve performance: you can send multiple spans or metrics in a single request to reduce the number of outbound calls.
Ensure You Have Comprehensive Instrumentation
Ensure all the necessary components are instrumented to capture relevant data. Incomplete or inconsistent instrumentation can lead to gaps in data, making analysis challenging.
Here are a few tips for enriching your instrumentation data:
- Propagate context: Ensure that all necessary details in the request get propagated in the instrumentation data (this includes things like user ID and IP address).
- Instrument all services: Make sure to instrument every service you have, including third-party services, to avoid blind spots in your telemetry data.
- Review instrumentation data regularly: As you grow and develop your application, you'll likely introduce more data that can be used to enrich the instrumentation further.
- Ensure that you name your traces, logs and metrics consistently: This is crucial for effective data correlation during analysis.
Mind the Exporter Configuration
Pay close attention to your exporters’ configuration to prevent issues like data duplication or data loss due to misconfiguration. A few things to keep in mind when configuring your exporter:
- Make sure you choose the right exporter for your backend service. An exporter for Jaeger, for example, won't work for a Zipkin backend service.
- Configure retrying mechanisms to manage transient failures so that temporary network issues or backend failures don't result in instrumentation loss.
- Consider using sampling mechanisms to reduce the number of instrumentation signals exported. This is particularly important in high-traffic applications.
Tips for Efficiently Analyzing OpenTelemetry Data
Here are some tips for gaining valuable insights from the data you collect:
- Use `TraceIds` and `SpanIds`: These help you build complete end-to-end visibility in your system for a particular request, enabling you to understand what it does across several system components.
- Use metrics: OpenTelemetry metrics can give you early warning signals about potential issues in your application, such as delayed API responses. Set up relevant alerts using email, SMS or push notifications.
- Prioritize key metrics: Your system will most likely generate numerous metrics, which can be overwhelming (and often inconsequential) to analyze and track. Figure out what actually matters for your business and focus on that. For instance, does API response time over an average user session matter?
- Use dashboards: Dashboards give you an overview of the different aspects of your system. Use them to reduce mental workload when analyzing telemetry data.
Tools and Platforms Compatible with OpenTelemetry
Several tools in the market can be used to analyze OpenTelemetry data:
- Grafana is renowned for its intuitive dashboards. It integrates seamlessly with Prometheus to provide real-time metrics visualizations.
- Prometheus is a powerful monitoring and alerting toolkit that is often paired with Grafana for enhanced visualization capabilities.
- Kibana (Elastic Stack) excels at logging data exploration and visualization and offers powerful querying capabilities as part of the Elastic Stack.
- Splunk is a leader in the log management space. It provides advanced analytics features and a vast library of integrations.
- New Relic is an all-in-one observability platform, combining application performance monitoring (APM), infrastructure monitoring and log management in a unified interface.
When choosing a tool, consider the specific needs of your infrastructure, the level of data granularity you require and the level of customization and integration capabilities each platform offers. Leveraging these tools effectively can provide valuable insights, helping SRE teams proactively address issues, optimize performance and ensure system reliability.
Conclusion
By integrating OpenTelemetry into your .NET applications you can get unified observability using a single set of APIs exposed via the SDK; the freedom to choose a backend visualization service, such as Grafana and Prometheus; and end-to-end tracing, which lets you easily debug distributed microservices using SpanId and TraceId.
If you're looking to implement OpenTelemetry in your application, check out the following resources:
- The OpenTelemetry .NET GitHub repository contains source code, examples and extensive documentation. This is a great starting point for anyone looking to learn more about OpenTelemetry with .NET.
- The Getting Started with OpenTelemetry .NET tutorial provides a step-by-step guide for instrumenting a .NET application with OpenTelemetry.
- The OpenTelemetry .NET API Documentation offers detailed information on classes, methods and properties available in the .NET SDK.
- The OpenTelemetry community is a great place to find forums, webinars and additional resources to help you get the most out of OpenTelemetry in .NET.