Unleashing the Power of Multi-Cloud Kubernetes—a Tutorial
Set up a cluster across multiple cloud providers and then watch it failover and maintain uptime as one of the clouds suffers a simulated outage.

Whether you’re designing a multi-cloud architecture for flexibility, high availability, compliance or any other reason, Kubernetes can be a powerful solution for integrating multiple cloud services into a unified, resilient infrastructure.
There are, of course, challenges with implementing a multi-cloud Kubernetes topology, one being the initial setup of a multi-cloud Kubernetes cluster. Each cloud provider has its own unique features and requirements, making configuration of a cluster that spans multiple platforms a complex task. Integrating a CI/CD pipeline into a multi-cloud environment can be equally challenging; coordination of CI/CD tools across different cloud platforms must be seamless. Another major challenge is distributing loads across different cloud providers to control costs.
Still, the benefits of multi-cloud Kubernetes far outweigh its challenges. One particular benefit is the resilience of multi-cloud Kubernetes deployments during a cloud provider outage. This tutorial guides you step by step through implementing a multi-cloud Kubernetes cluster and then shutting one of the providers down to observe the failover and recovery process.
More about using Kubernetes:
- Installing and Deploying Kubernetes on Ubuntu
- Understanding Kubernetes Network Policies
- So You Want to Run Kubernetes On Bare Metal
- Kubernetes Management Tools for Bare Metal Deployments
Selecting OS and Cloud Providers
Let's start by choosing your cloud providers.
By definition, a multi-cloud environment involves two or more distinct cloud providers. So, in theory, you only need to choose two or more providers to create a multi-cloud Kubernetes cluster.
In practice, though, there are more decisions to make. You need to choose a region that provides lower latency and optimal performance to your apps, understand what disaster recovery services each provider offers, the costs and more.
But, since this tutorial is only demonstrating multi-cloud resiliency, three different cloud providers will suffice. Any major Linux distribution will do.
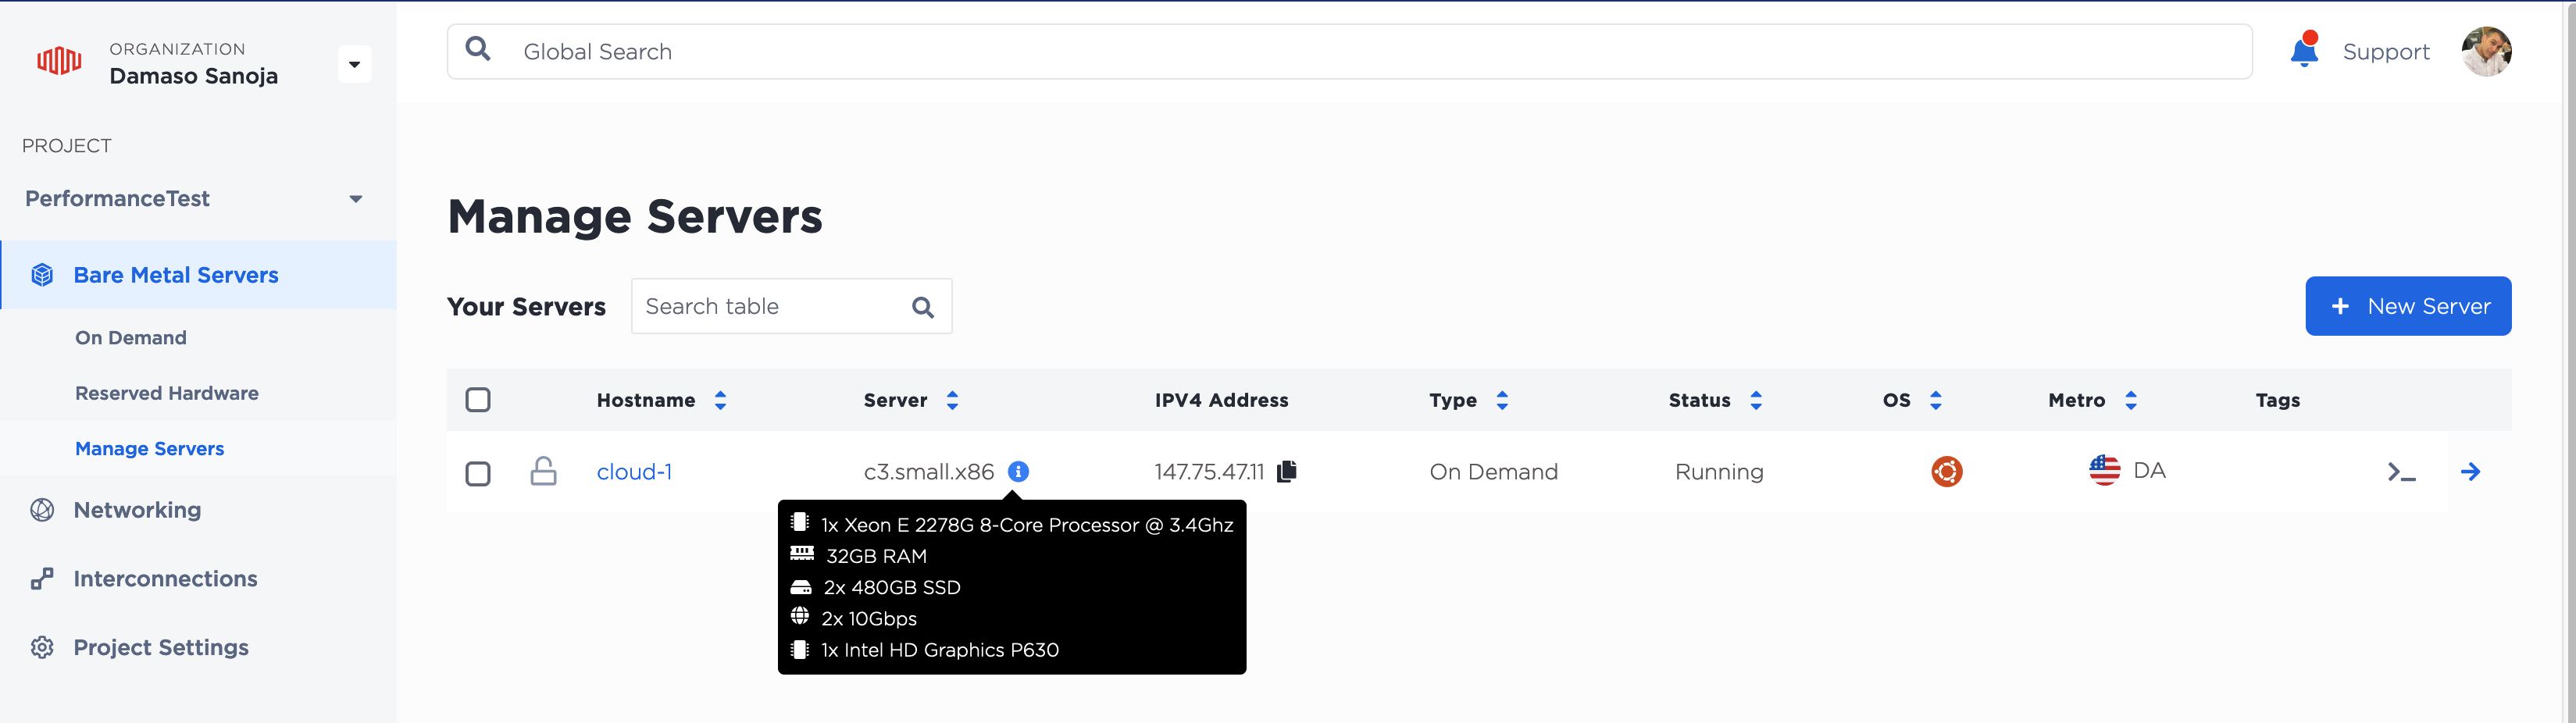
Here’s the infrastructure I used to deploy the Kubernetes cluster for this tutorial:
- Three Ubuntu 22.04 LTS instances:
cloud-1,cloud-2andcloud-3 - A c3.small.x86 bare metal server from Equinix, since the node that serves as the control plane is usually resource-hungry
- VMs with 4 GB of RAM and 2 vCPUs each from Vultr and Linode for the other two nodes
Once you launch the three VMs, note their public IPs; you’ll need those shortly.
Once your instances are ready, it’s time to prepare them for Kubernetes.
Setting Up a Multi-cloud Kubernetes Cluster
First, let’s prepare each instance and configure the Kubernetes control plane and worker nodes.
Preparing the Environment
If you've been in DevOps for any length of time, you know that there are tons of ways to implement a Kubernetes cluster. How you prepare the nodes depends on which of those ways you choose. For example, you could use a specialized tool like kOps to create Kubernetes clusters on major cloud providers. Similarly, you could configure a vanilla Kubernetes cluster using kubeadm.
Although valid, both examples require lengthy setup processes, with manual configuration for dependencies. That would be pretty distracting for this tutorial, so I’m using RKE2, or Rancher Kubernetes Engine 2. It is a security and compliance focused CNCF-certified Kubernetes distribution that maintains close alignment with upstream Kubernetes. It’s also easy to install, which is one of its biggest advantages. All you have to do is set Fully Qualified Domain Names (FQDNs) for each node and then run a script as root on each one.
Let's start with the cloud-1 node, which will be the control-plane.
Edit /etc/hosts using your favorite text editor. Here is this tutorial’s configuration:
127.0.0.1   localhost                   cloud-1
127.0.1.1   cloud-1.rke2.multicloud     cloud-1
# The following lines are desirable for IPv6-capable hosts:
::1 localhost ip6-localhost ip6-loopback
ff02::1 ip6-allnodes
ff02::2 ip6-allrouters
Feel free to change the FQDN to suit your needs. Depending on your cloud provider, you may need to edit /etc/hostname to set cloud-1 as the hostname.
It's good practice to reboot the node after making these changes, so run reboot.
The procedure for cloud-2 and cloud-3 is similar to cloud-1. Edit /etc/hostname and /etc/hosts and make the corresponding changes. Don't forget to reboot both nodes before continuing.
Those are all the prerequisites for running RKE2's installation script. However, you'll need a monitoring tool to observe the behavior of your multi-cloud Kubernetes cluster when one provider fails. To keep everything simple and tidy, I use k9s, a Kubernetes-focused CLI with the ability to monitor Kubernetes nodes and pods from the terminal. You can install binaries for Windows, Linux and Mac. This tutorial uses k9s from a local machine, but, as you will see shortly, you can do it from cloud-1 if you like.
Once you finish preparing the nodes and installing k9s, you can configure the RKE2 cluster.
Configuring the Kubernetes Cluster
As already mentioned, this part is fairly straightforward. Let's start with the Kubernetes control plane that will be installed on cloud-1.
Setting Up Control Plane
This tutorial uses the steps described in RKE2's Quick Start guide, which involves this Bash script that you may want to review. You may edit that script, but the default values are sufficient.
As a final note, even though this tutorial uses Ubuntu 22.04 LTS, this script works for RHEL-based Linux distros as well.
SSH to cloud-1 and install RKE2 using the official script:
curl -sfL https://get.rke2.io | sh -
The next step is to enable the related service:
systemctl enable rke2-server.service
Now, start the service (this may take a few minutes):
systemctl start rke2-server.service
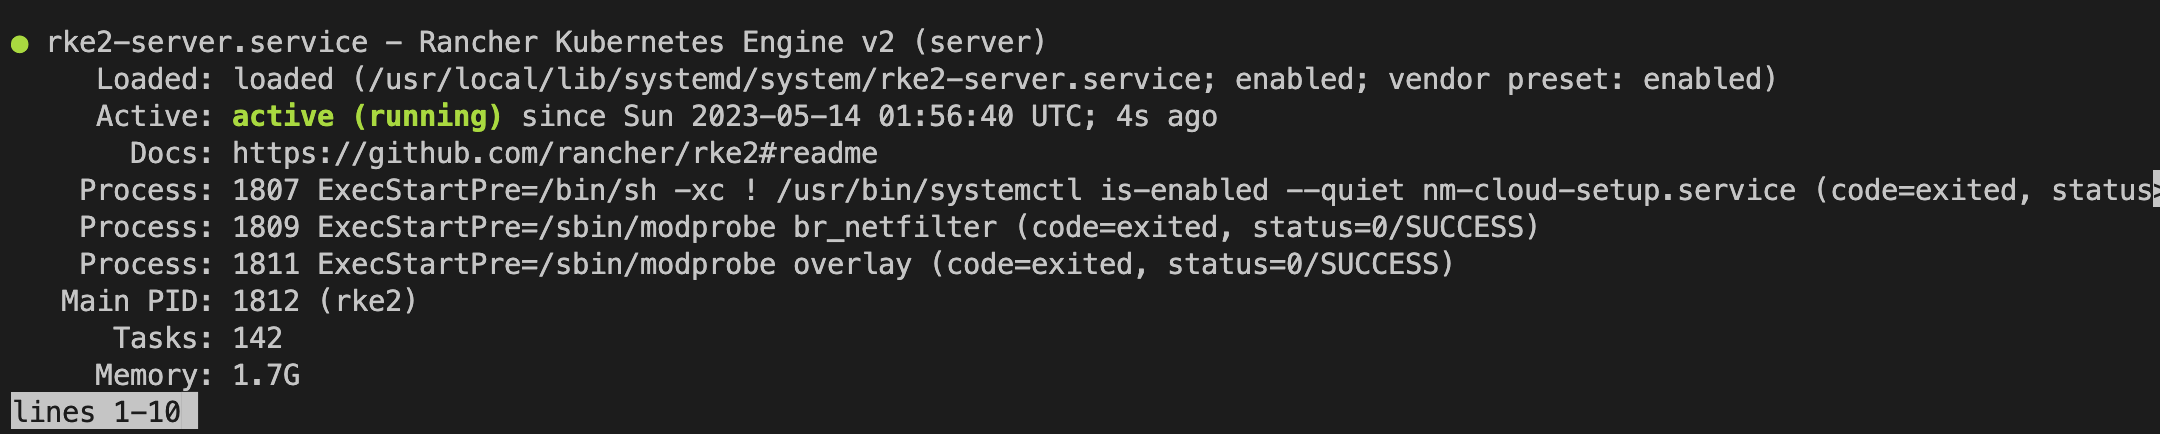
Verify service status by running the following command:
systemctl status rke2-server.service
Optionally, you can read the logs.
journalctl -u rke2-server -f
Besides streamlining RKE2 setup, the script installs the following tools for you:
kubectl: A Kubernetes command-line tool used to communicate with thecontrol-planenode through the Kubernetes API servercrictl: A command-line interface for CRI-compatible container runtimes, handy for inspecting and debugging container runtimes and applications on a Kubernetes node.ctr: A command-line utility that manages and monitorscontainerd.
All tools are installed on /var/lib/rancher/rke2/bin/ by default. Additionally, a kubeconfig is saved at /etc/rancher/rke2/rke2.yaml. In other words, nothing prevents you from following this tutorial using kubectl from this node.
For example, you can verify that RKE2 is working as expected using the following command:
/var/lib/rancher/rke2/bin/kubectl get node --kubeconfig=/etc/rancher/rke2/rke2.yaml
The output should be similar to:
NAME     STATUS   ROLES                      AGE    VERSION

cloud-1  Ready    control-plane,etcd,master  109s   v1.25.9+rke2r1
But if you prefer to work from your local machine (recommended), you can install kubectl by following these instructions. Then copy kubeconfig to your local machine using something along the lines of:
cp /etc/rancher/rke2/rke2.yaml config
From your local machine, navigate to .kube or any other location of your choice and run:
scp root@{cloud-1-IP}:/root/config .
sudo chmod go-r config
Edit config to add the cloud-1 IP address:
- cluster:
certificate-authority-data: {...}
server: https://{cloud-1-IP}:6443
To copy the access token created during the RKE2 deployment, run the following command from cloud-1:
cat /var/lib/rancher/rke2/server/node-token
That’s it for this node. Keep the access token safe, as you’ll need it to configure the worker nodes in a bit.
Setting Up Worker Nodes
The procedure for setting up cloud-2 and cloud-3 is similar to the one you just ran through.
SSH to each node and run the same script, but this time add the environment variable INSTALL_RKE2_TYPE=agent as shown here:
curl -sfL https://get.rke2.io | INSTALL_RKE2_TYPE="agent" sh -
Wait for the script to finish and then enable rke2-agent.service:
systemctl enable rke2-agent.service
Before starting the service, you need to create a configuration file. Run the following command on each node:
mkdir -p /etc/rancher/rke2/
Next, create a file called /etc/rancher/rke2/config.yaml on each node. The content of both files is the same, something like:
server: https://{cloud-1-IP}:9345
token: {your-access-token}
Replace {cloud-1-IP} and {your-access-token} with the values corresponding to your installation, then save and exit the file.
Now you can start the service on each node:
systemctl start rke2-agent.service
You can check the cluster status using kubectl get node. After a few minutes you should see something similar to:
NAME      STATUS   ROLES                      AGE   VERSION
cloud-1   Ready    control-plane,etcd,master  12m   v1.25.9+rke2r1
cloud-2   Ready    <none>                     3m56s v1.25.9+rke2r1
cloud-3   Ready    <none>                     67s   v1.25.9+rke2r1
At this point, you have set up three nodes on different cloud providers that make up an RKE2 cluster. You’re all set to start testing how the cluster operates when one of these providers fails.
Demonstrating Failover and Recovery
To demonstrate the failover and recovery process of your multi-cloud Kubernetes cluster, you'll need to deploy a workload on it. This tutorial uses the following dummy deployment:
apiVersion: apps/v1
kind: Deployment
metadata:
  name: multicloud-workload
  labels:
app: multicloud-workload
spec:
  replicas: 200
  selector:
matchLabels:
   type: multicloud-workload
  template:
metadata:
   labels:
     type: multicloud-workload
spec:
   topologySpreadConstraints:
     - maxSkew: 1
       topologyKey: kubernetes.io/hostname
       whenUnsatisfiable: ScheduleAnyway
       labelSelector:
         matchLabels:
           type: multicloud-workload
   containers:
   - name: multicloud-workload
     image: nginxinc/nginx-unprivileged
This manifest basically launches 200 replicas of multicloud-workload, an app that uses the nginx-unprivileged Docker image.
(You might wonder why this deployment uses topology spread constraints. In a nutshell, it distributes pods evenly across the nodes. We'll come back to this in a moment.)
Save multicloud-workload.yml and deploy it to your cluster:
kubectl apply -f multicloud-workload.yml
To verify the deployment, you can use the following command, which conveniently groups pods by nodes:
kubectl get pod -o=custom-columns=NODE:.spec.nodeName,NAME:.metadata.name --all-namespaces | sort -r
The result should be similar to:
cloud-3   multicloud-workload-7fdf789f84-4tvk2
cloud-3   multicloud-workload-7fdf789f84-4nqsx
cloud-3   multicloud-workload-7fdf789f84-4n2wc
cloud-2   multicloud-workload-7fdf789f84-6lb75
cloud-2   multicloud-workload-7fdf789f84-6jffl
cloud-2   multicloud-workload-7fdf789f84-5vp57
cloud-1   multicloud-workload-7fdf789f84-26dxs
cloud-1   multicloud-workload-7fdf789f84-24nrf
cloud-1   multicloud-workload-7fdf789f84-22lf6
Now, since you have k9s, it would be more useful to start the tool using the command k9s. You can use the tool to visualize what’s happening within the cluster in different ways. Depending on your configuration and terminal history, you’re probably in the Pod view.
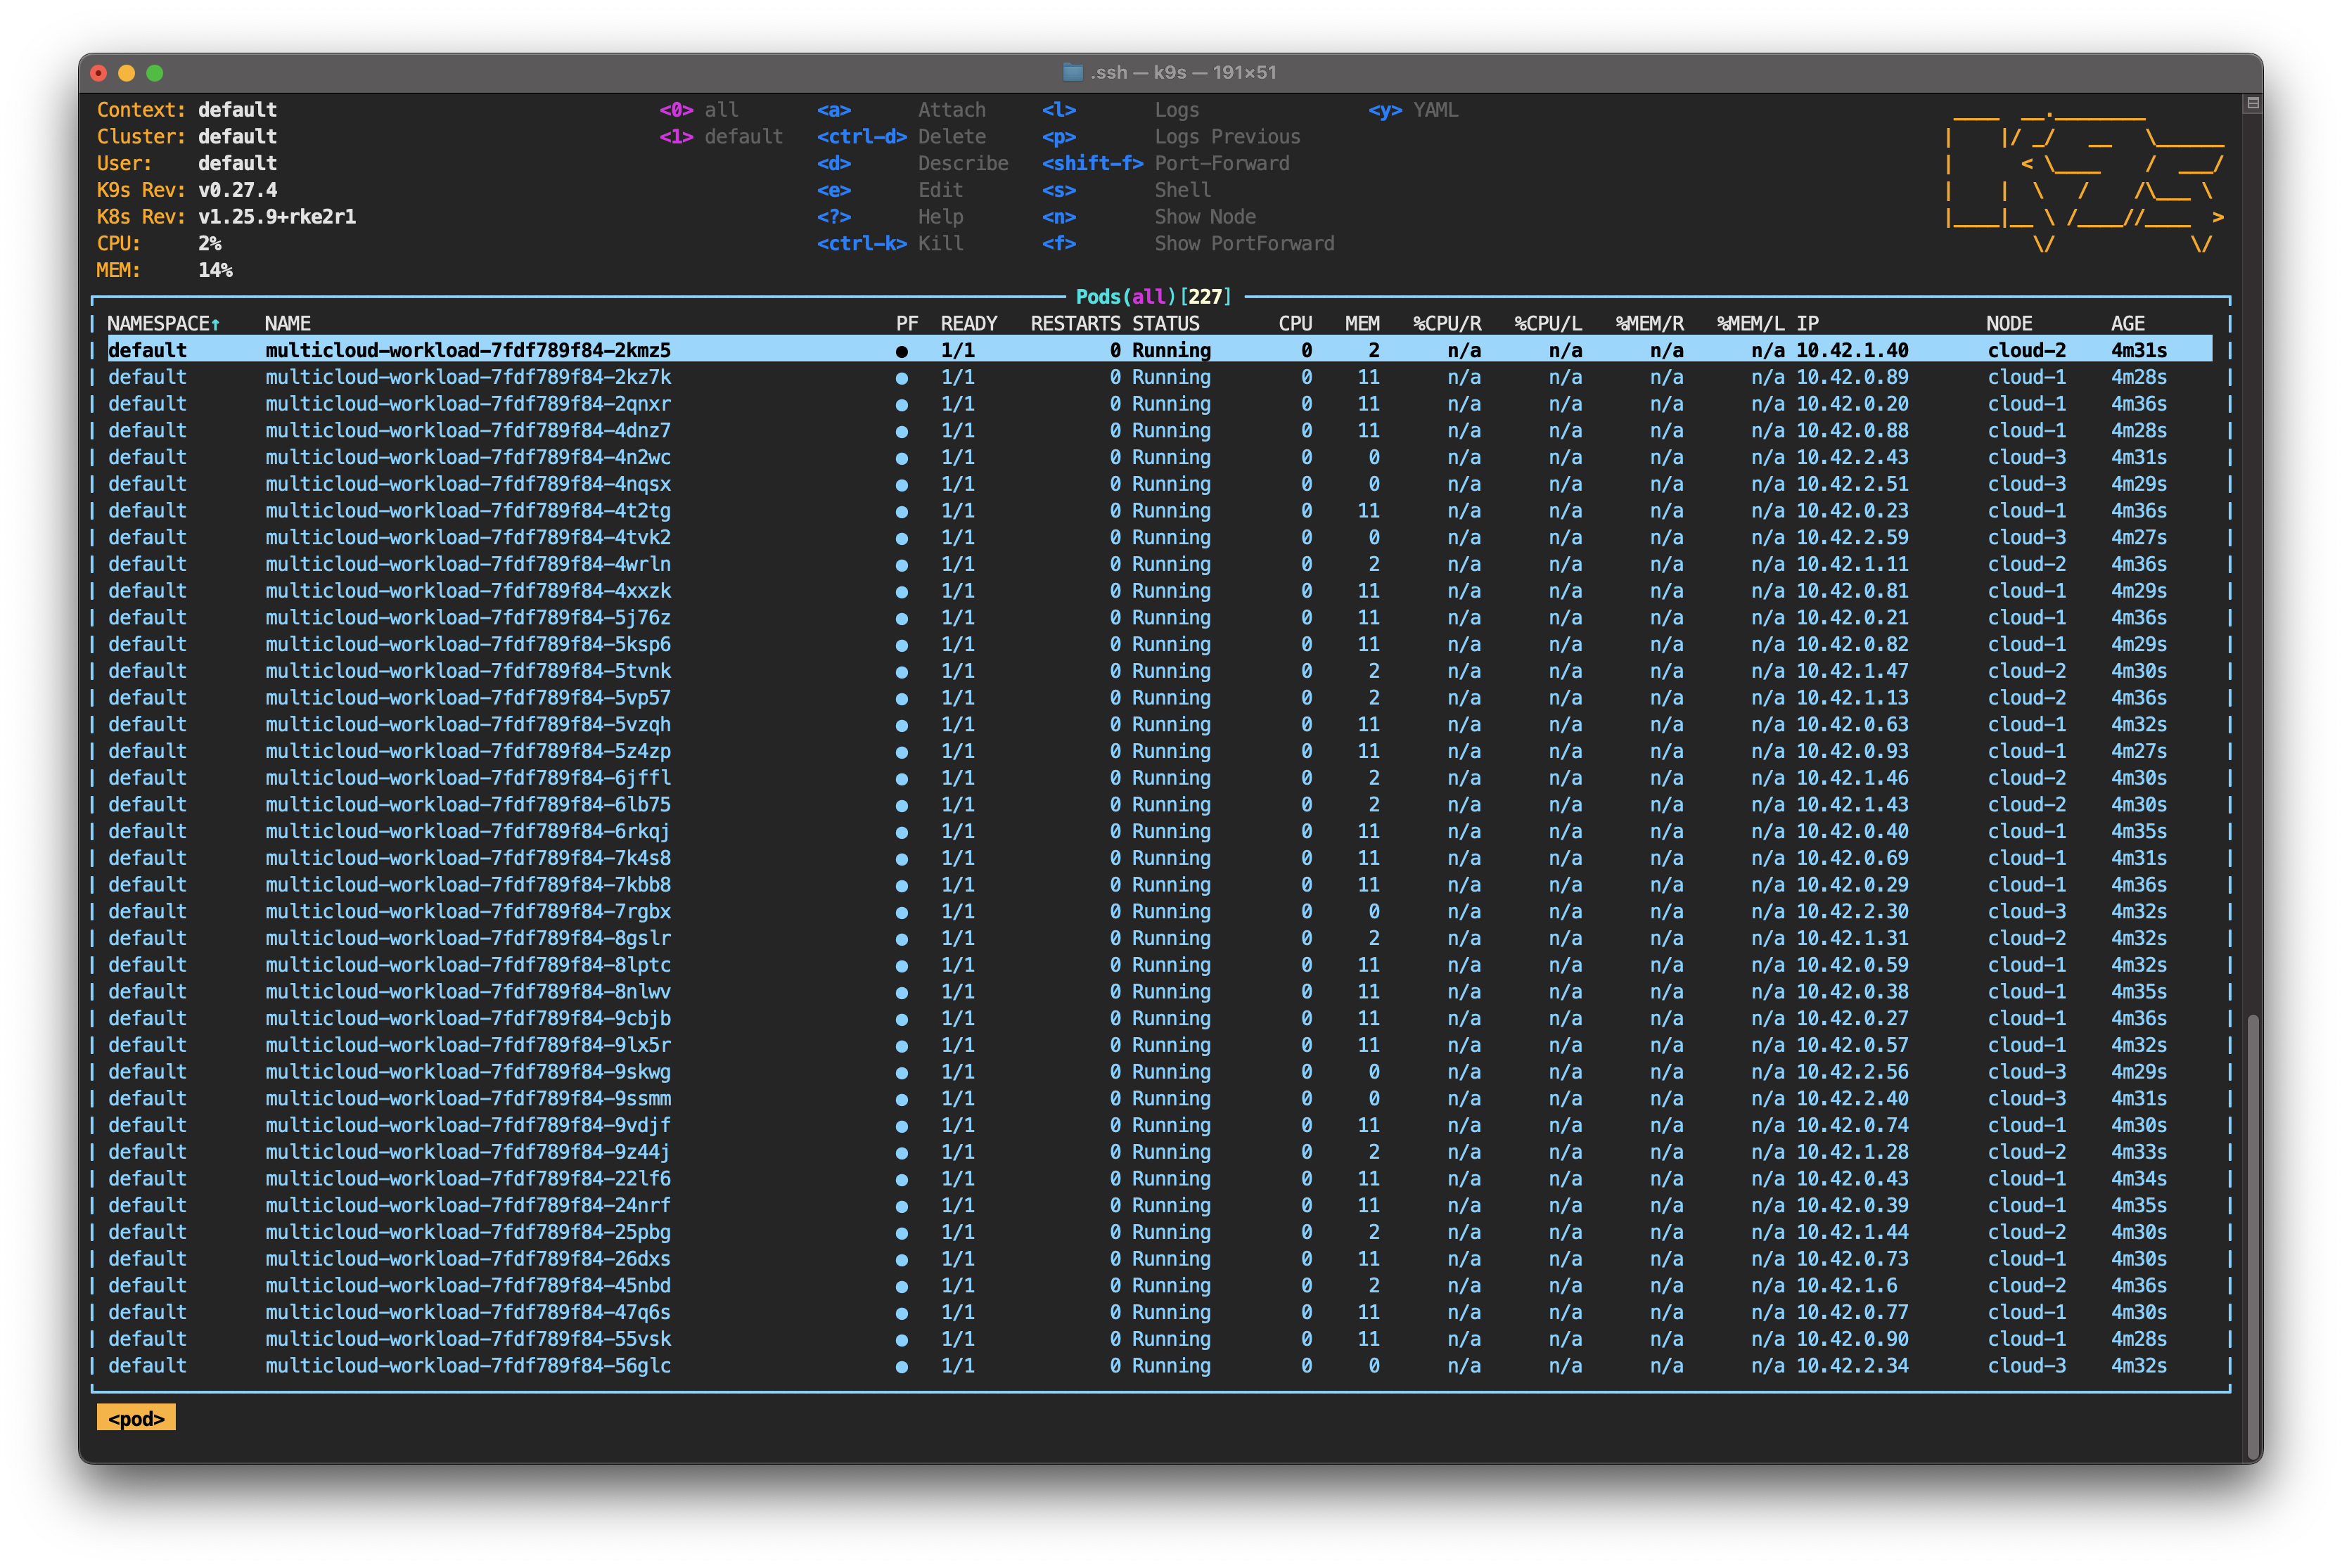
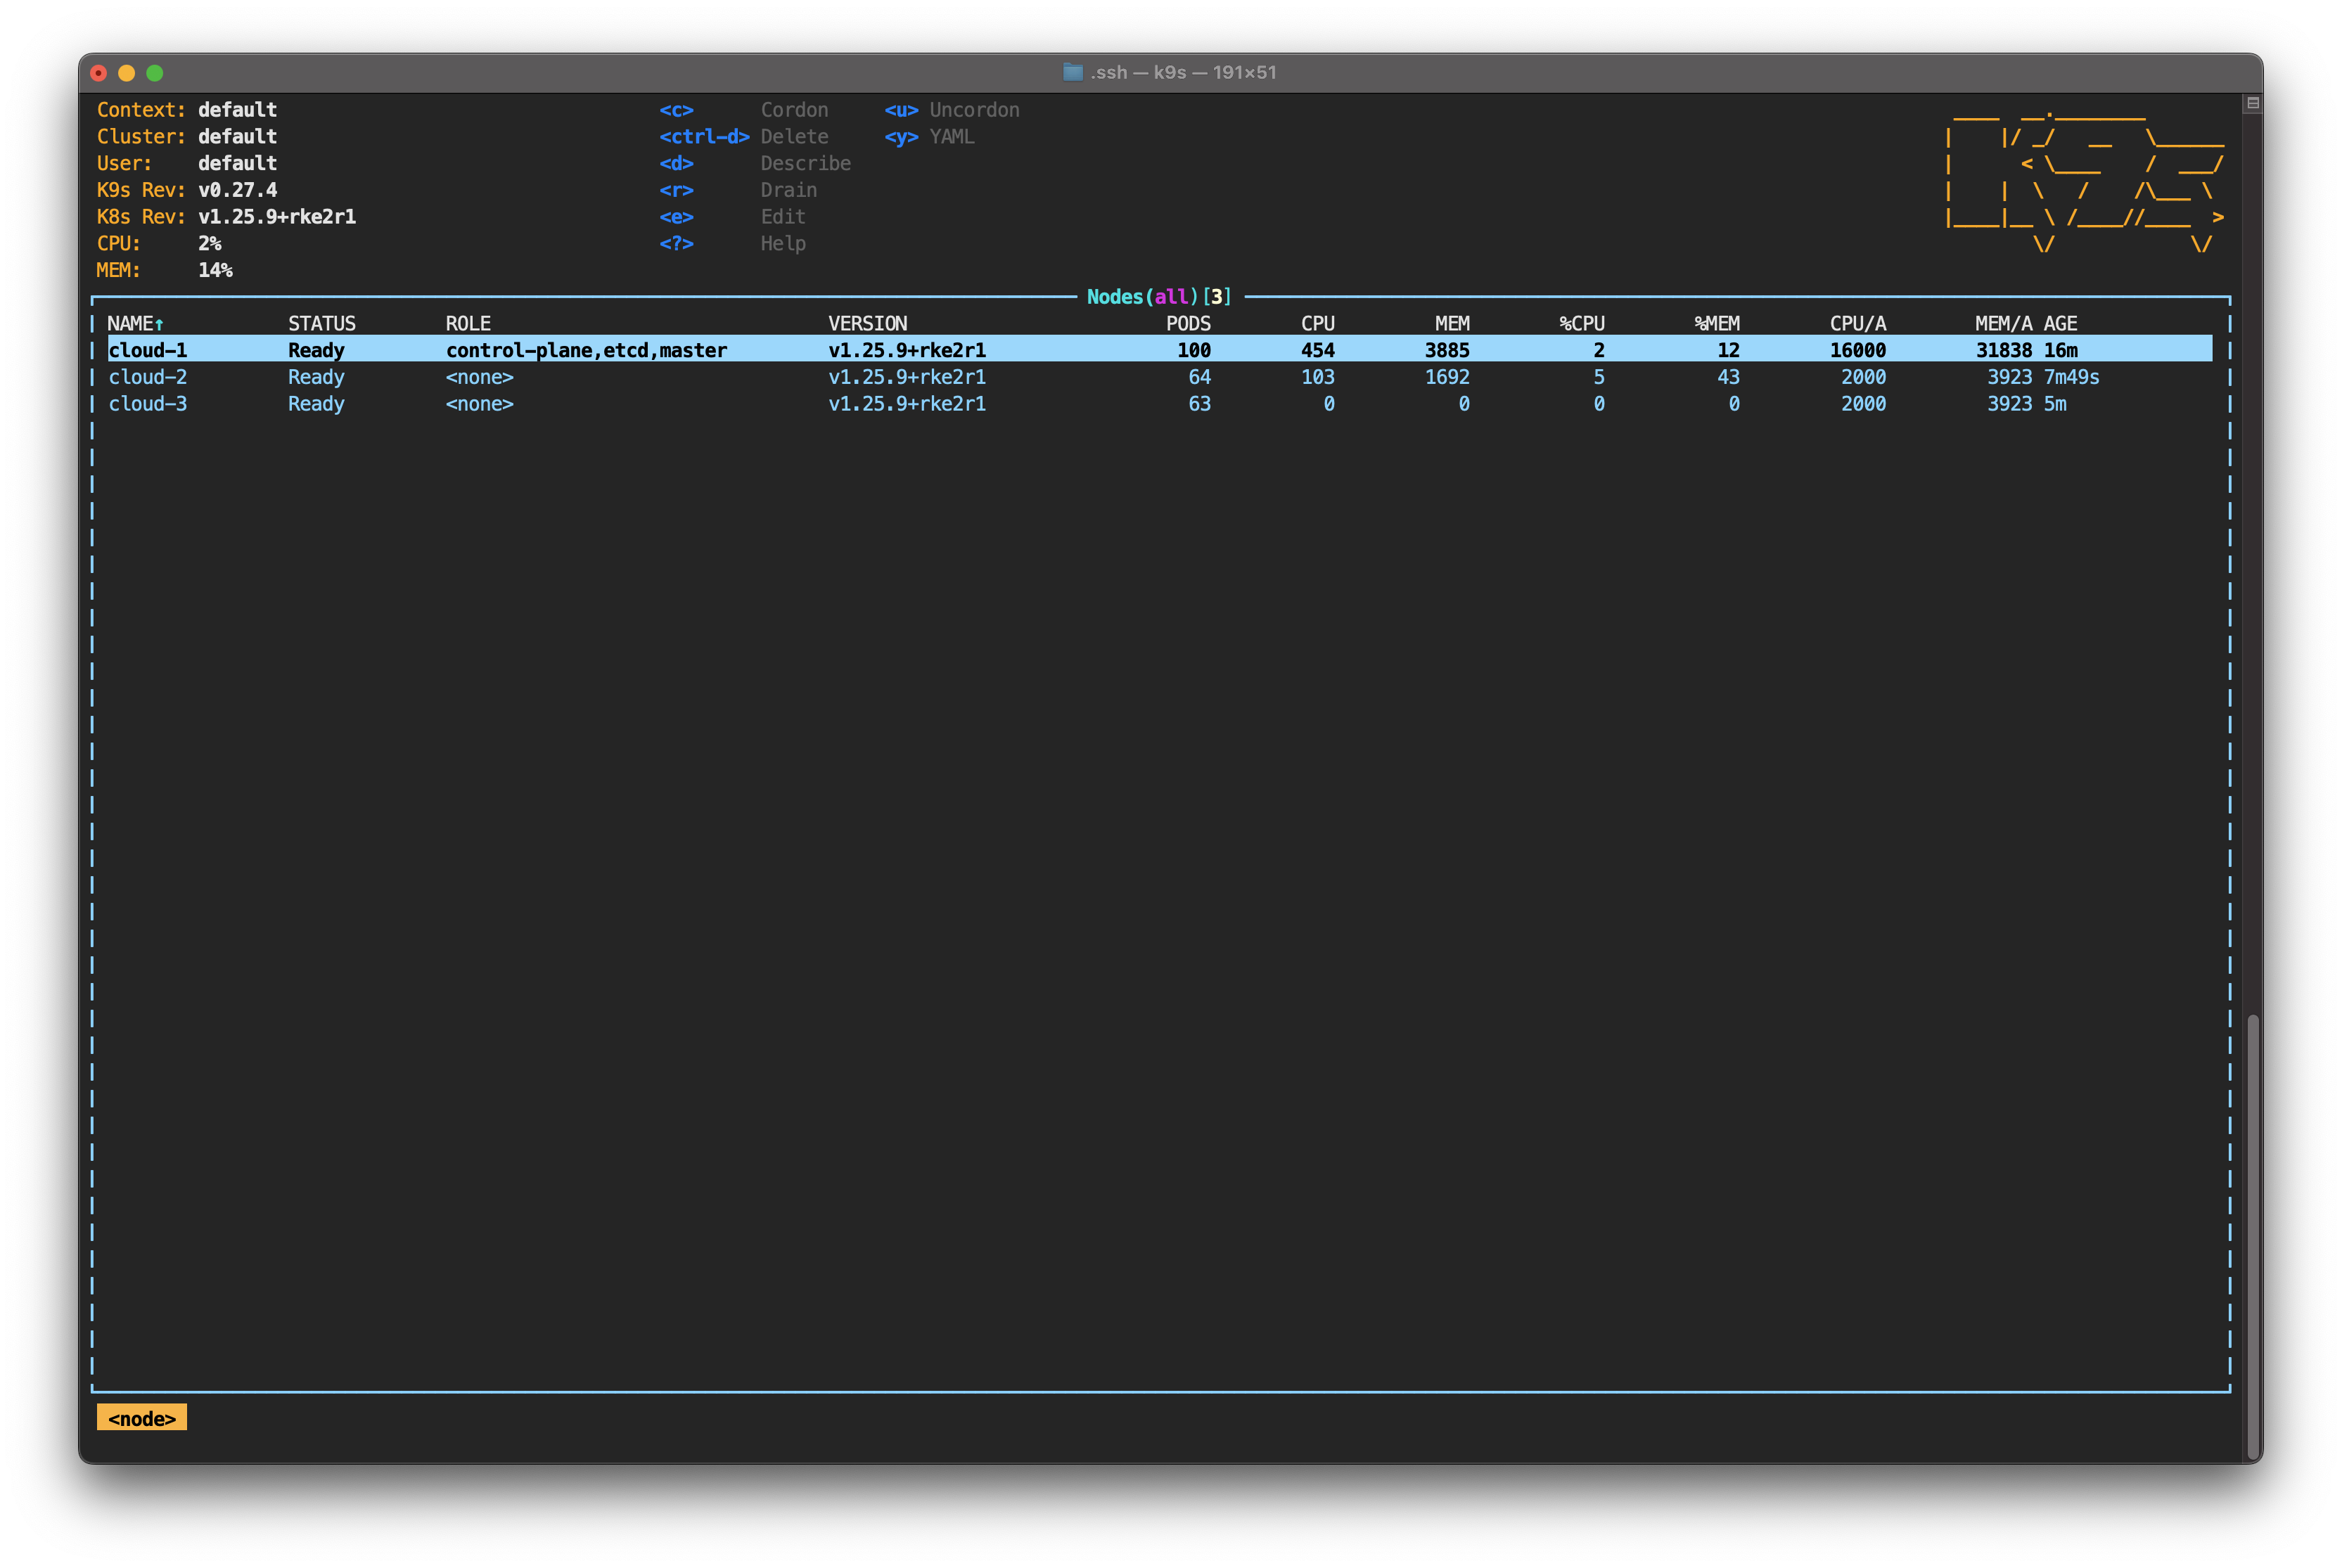
Type : to activate k9s' command line. Start typing node—you can hit Tab to auto-complete—and then hit Enter. Unlike kubectl get node, k9s shows the status of each node in real-time. It also allows you to monitor CPU, memory and the number of pods running on each node.
For now, focus your attention on the pods. Take note of how evenly they’re distributed among the nodes. It's time to change that by simulating a service interruption on one of them.
Simulating a Provider Outage
An easy way to simulate an outage is to take down a node. To do so, either SSH to cloud-3 and run poweroff or shut down the node from the cloud provider’s dashboard.
Pay attention to the k9s screen; you’re about to start noticing the effects.
Observing Cluster Failover
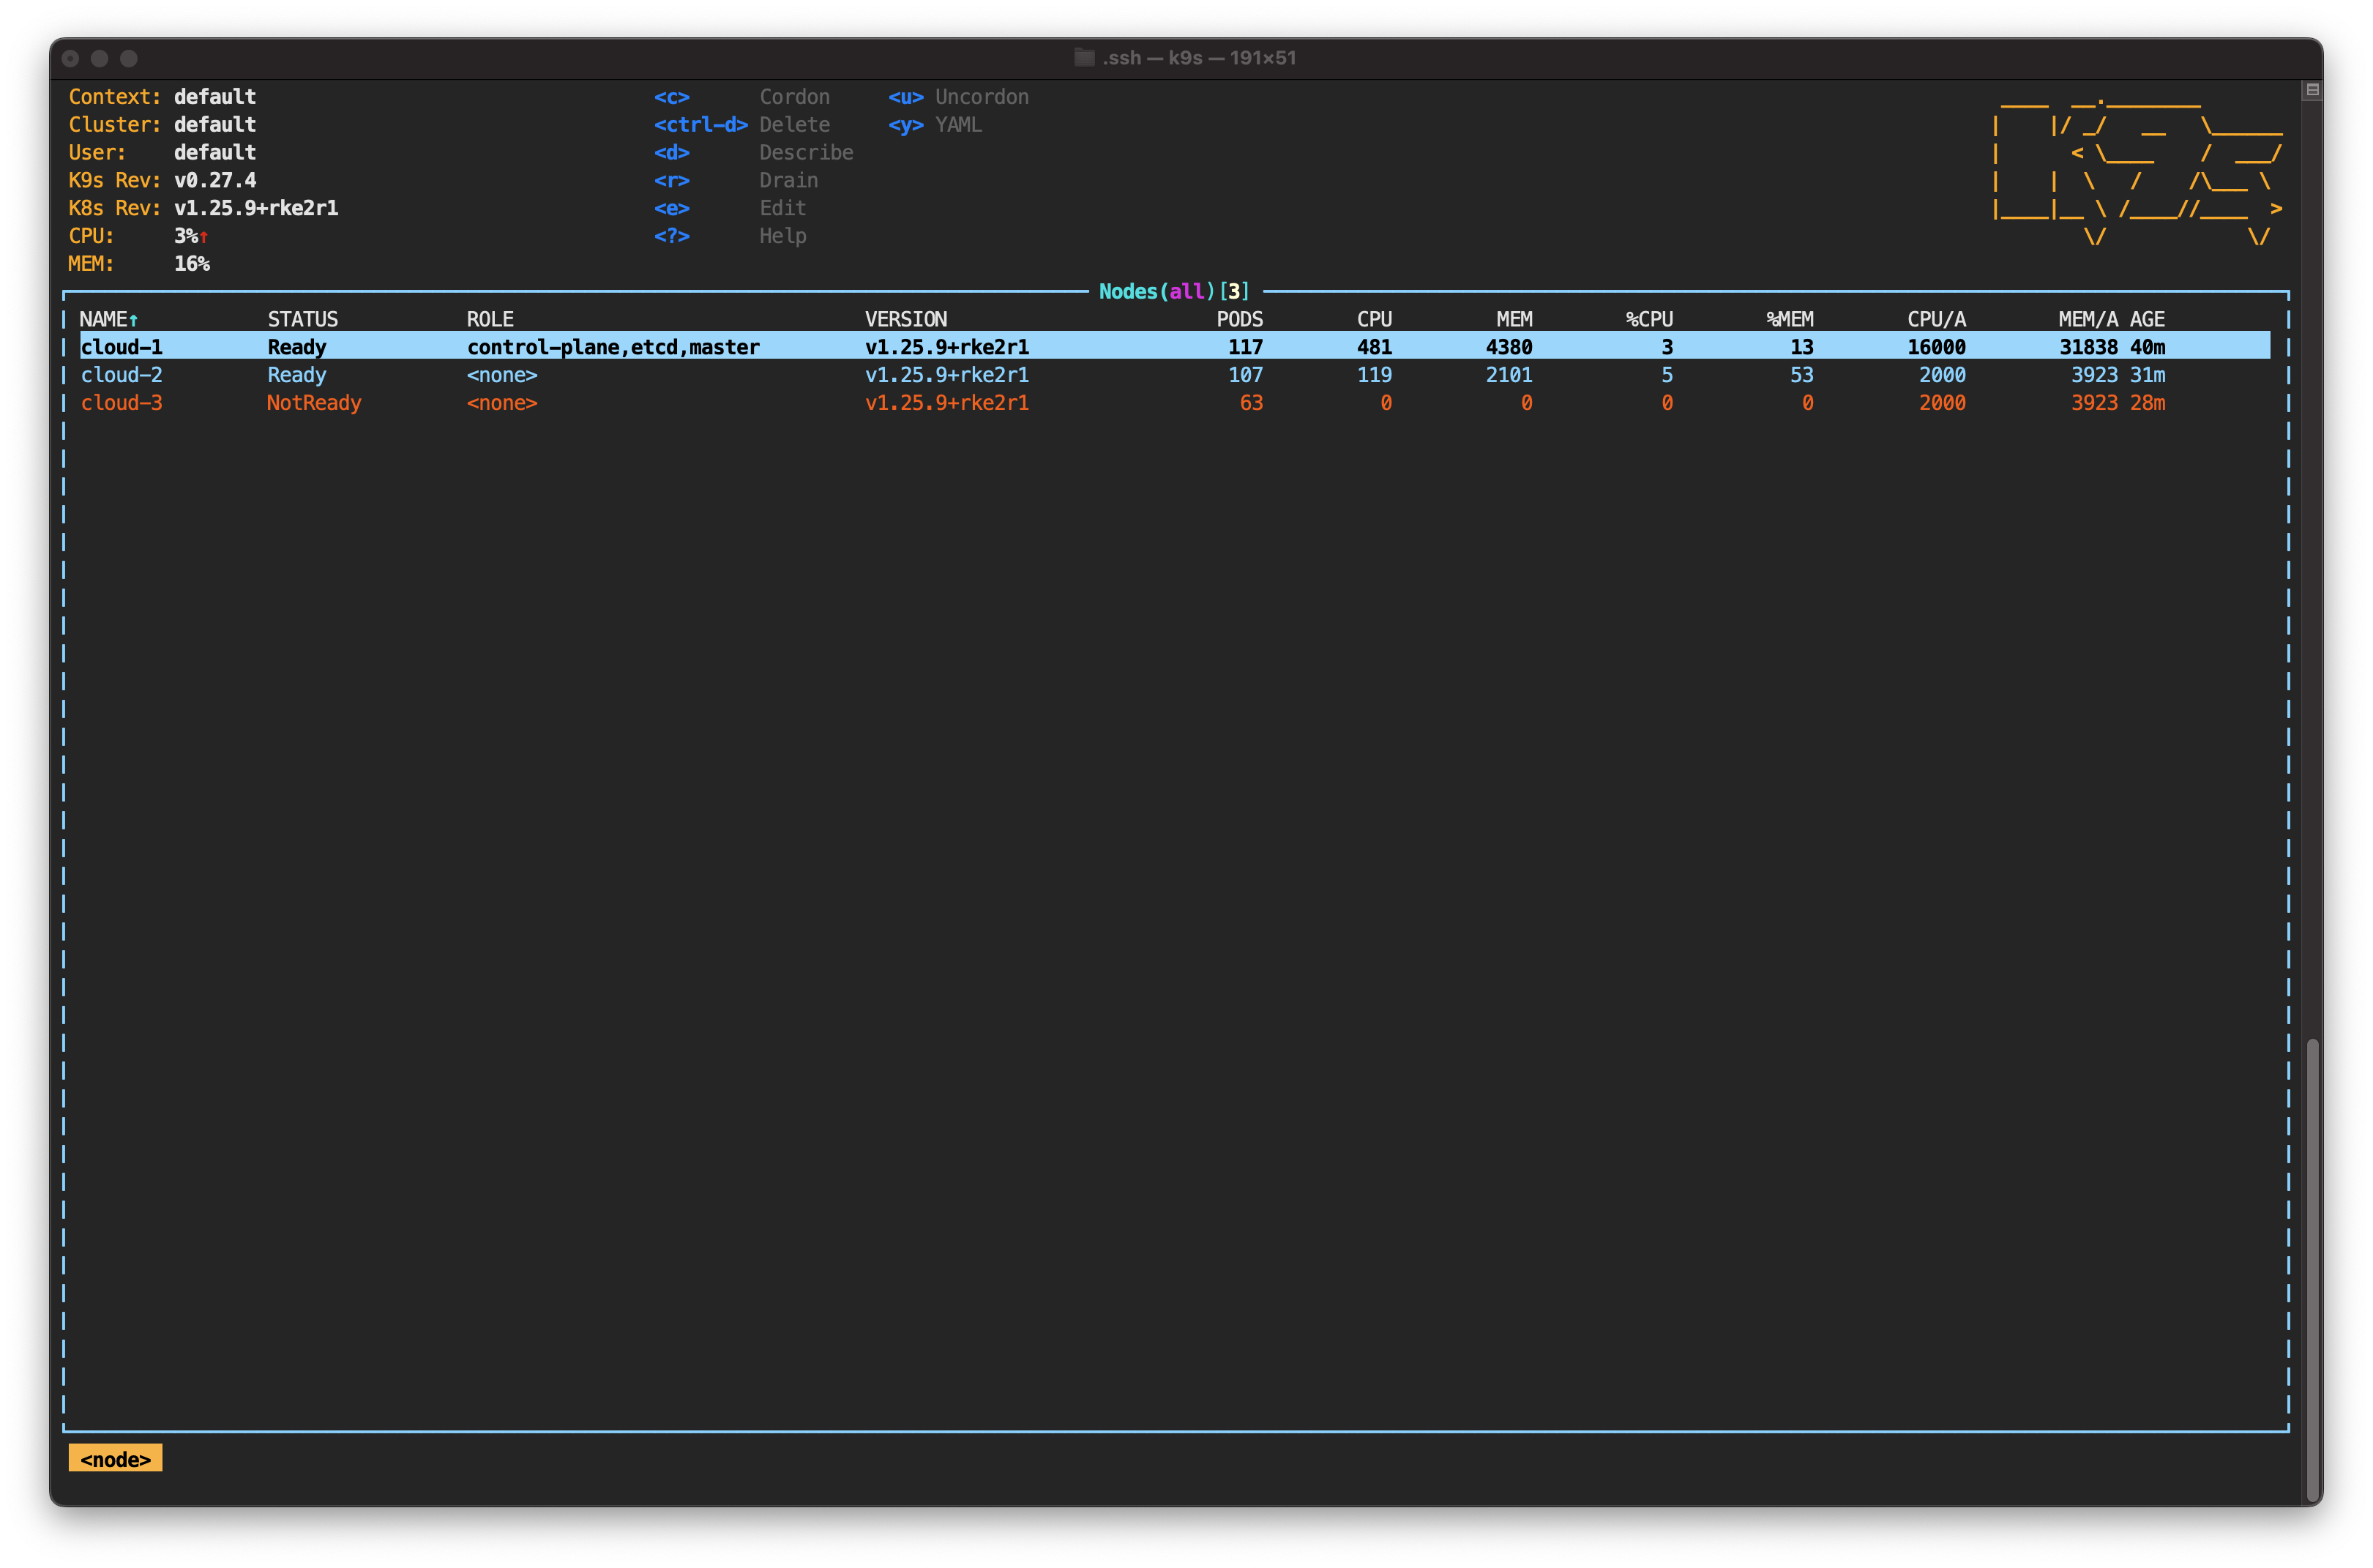
Still in the node view, you should see the status of cloud-3 change to NotReady.
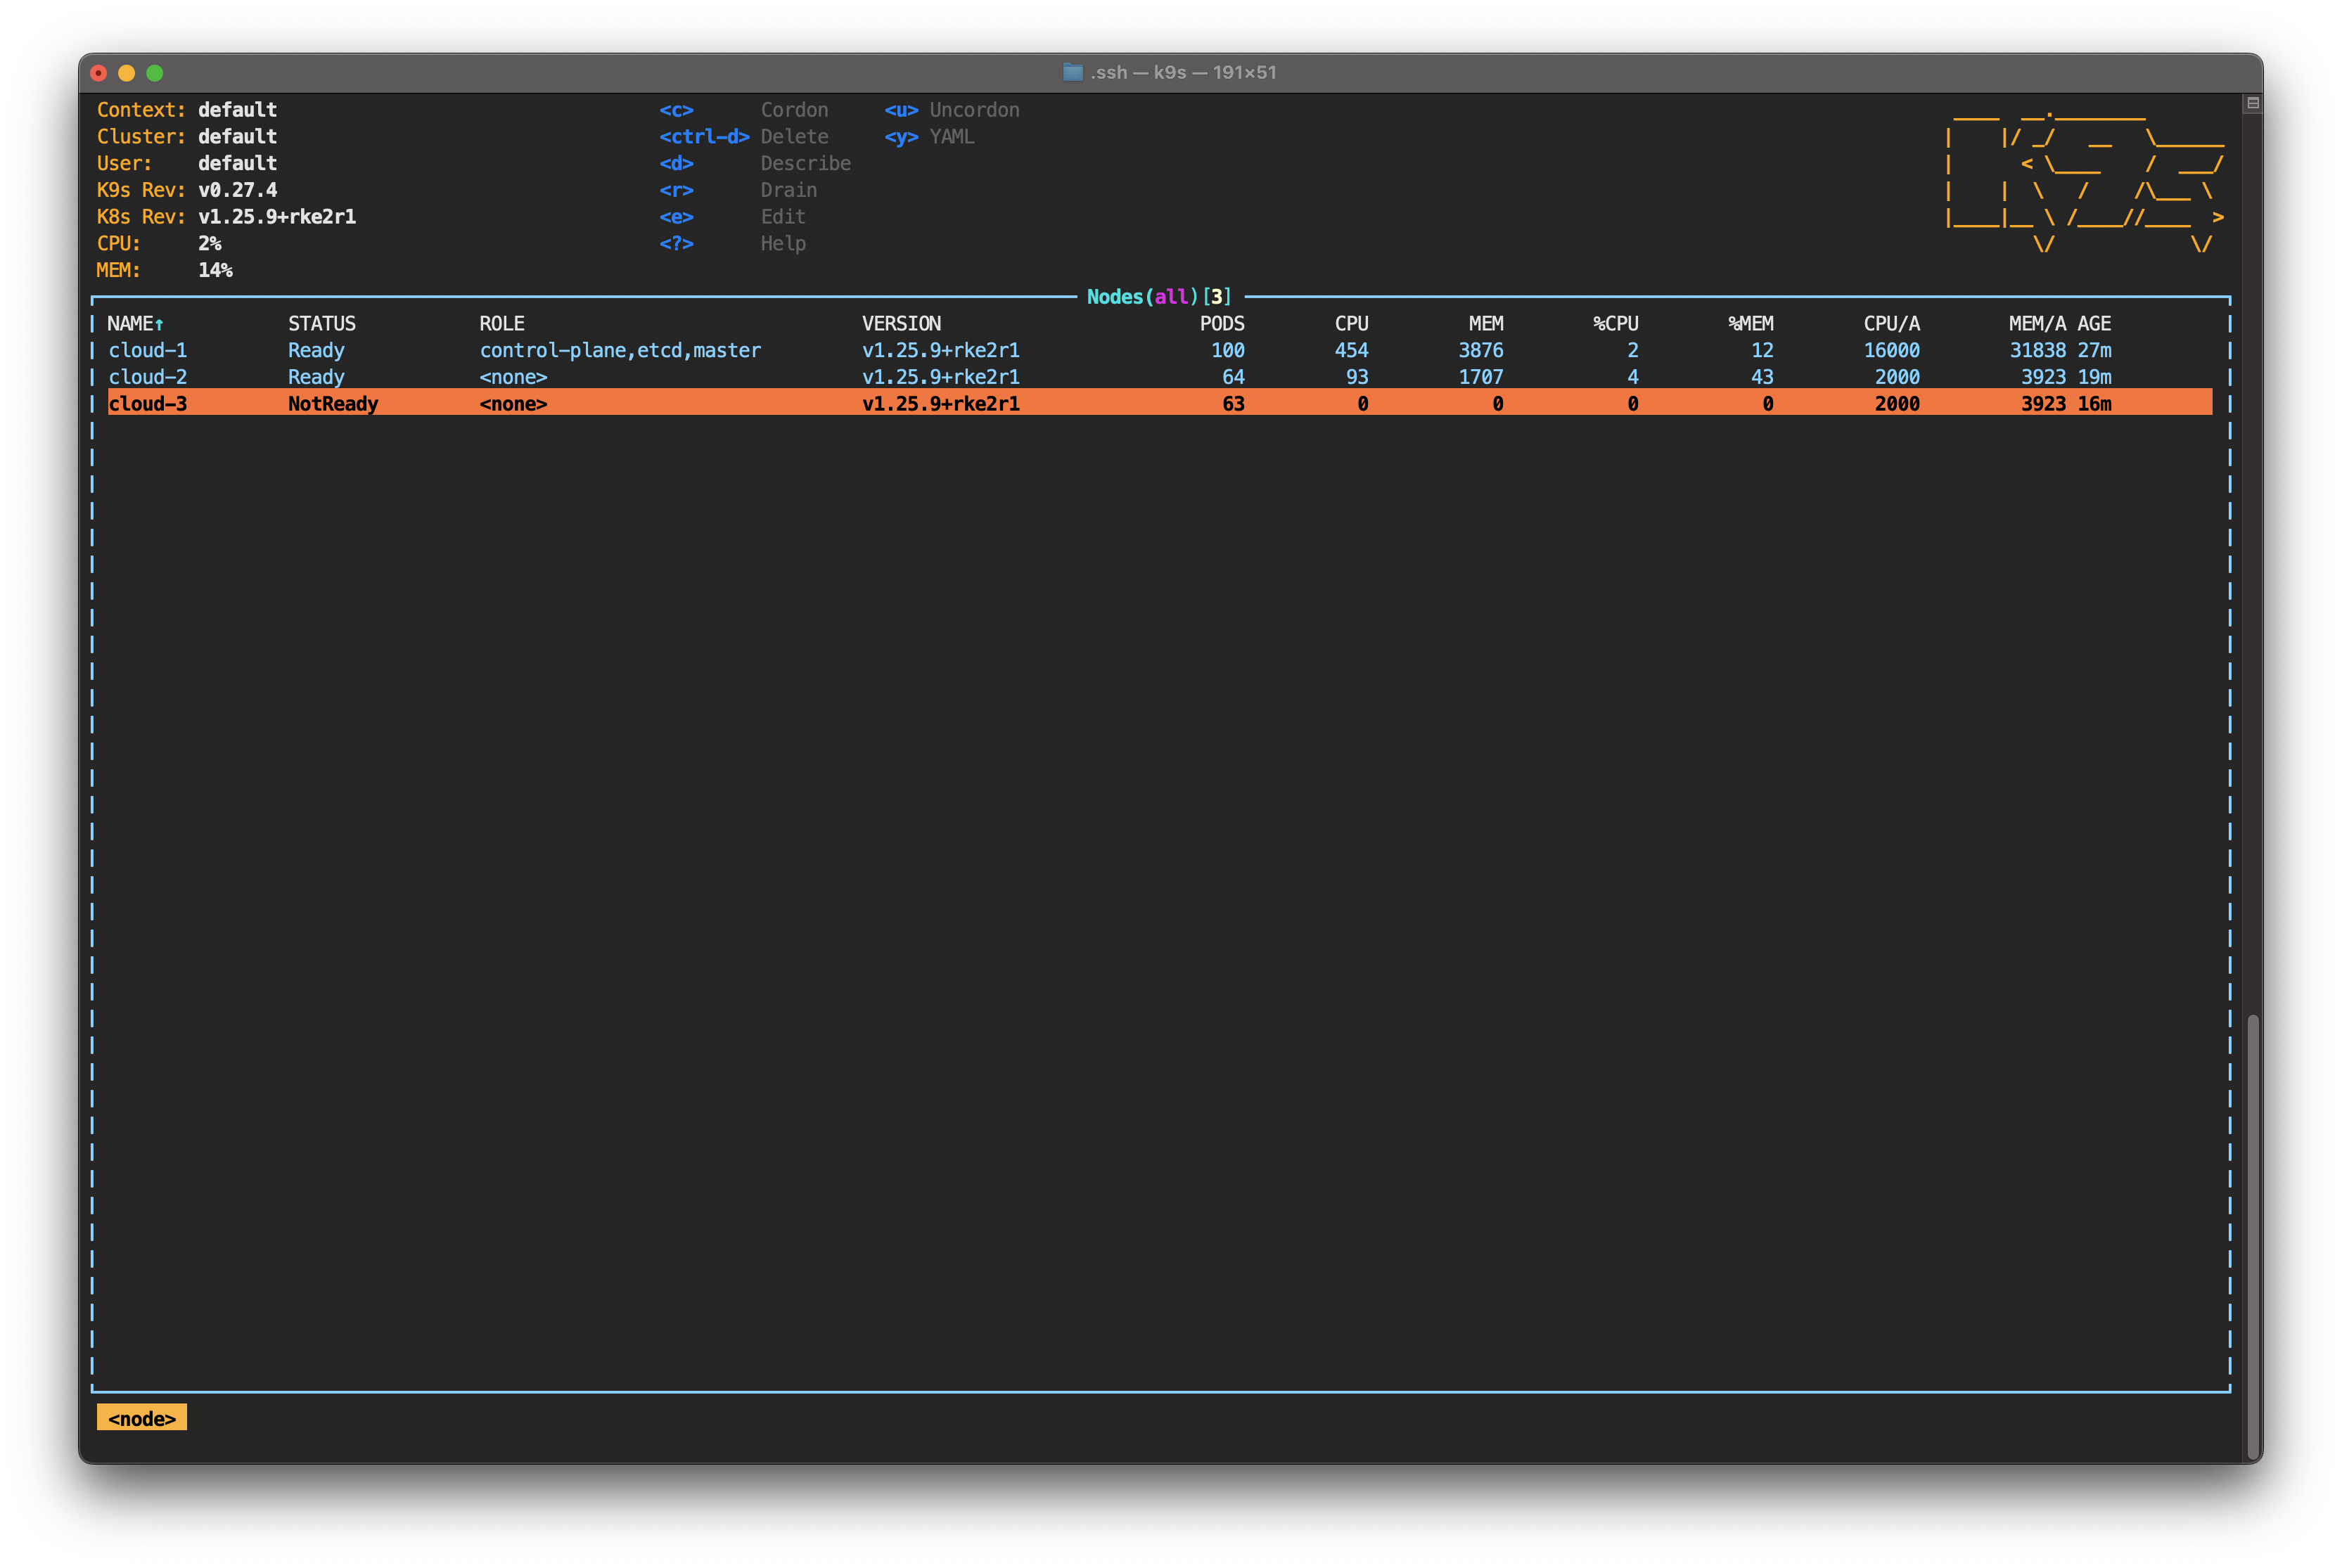
This happens because the cloud-controller-manager running on the control plane detected that cloud-3 is not responding. As this is occurring, cloud-3 is given node.kubernetes.io/unreachable, which prevents scheduling new pods on that node.
However, if you use the down arrow on your keyboard to select cloud-3 and press Enter, you’ll notice that the pods are still running.
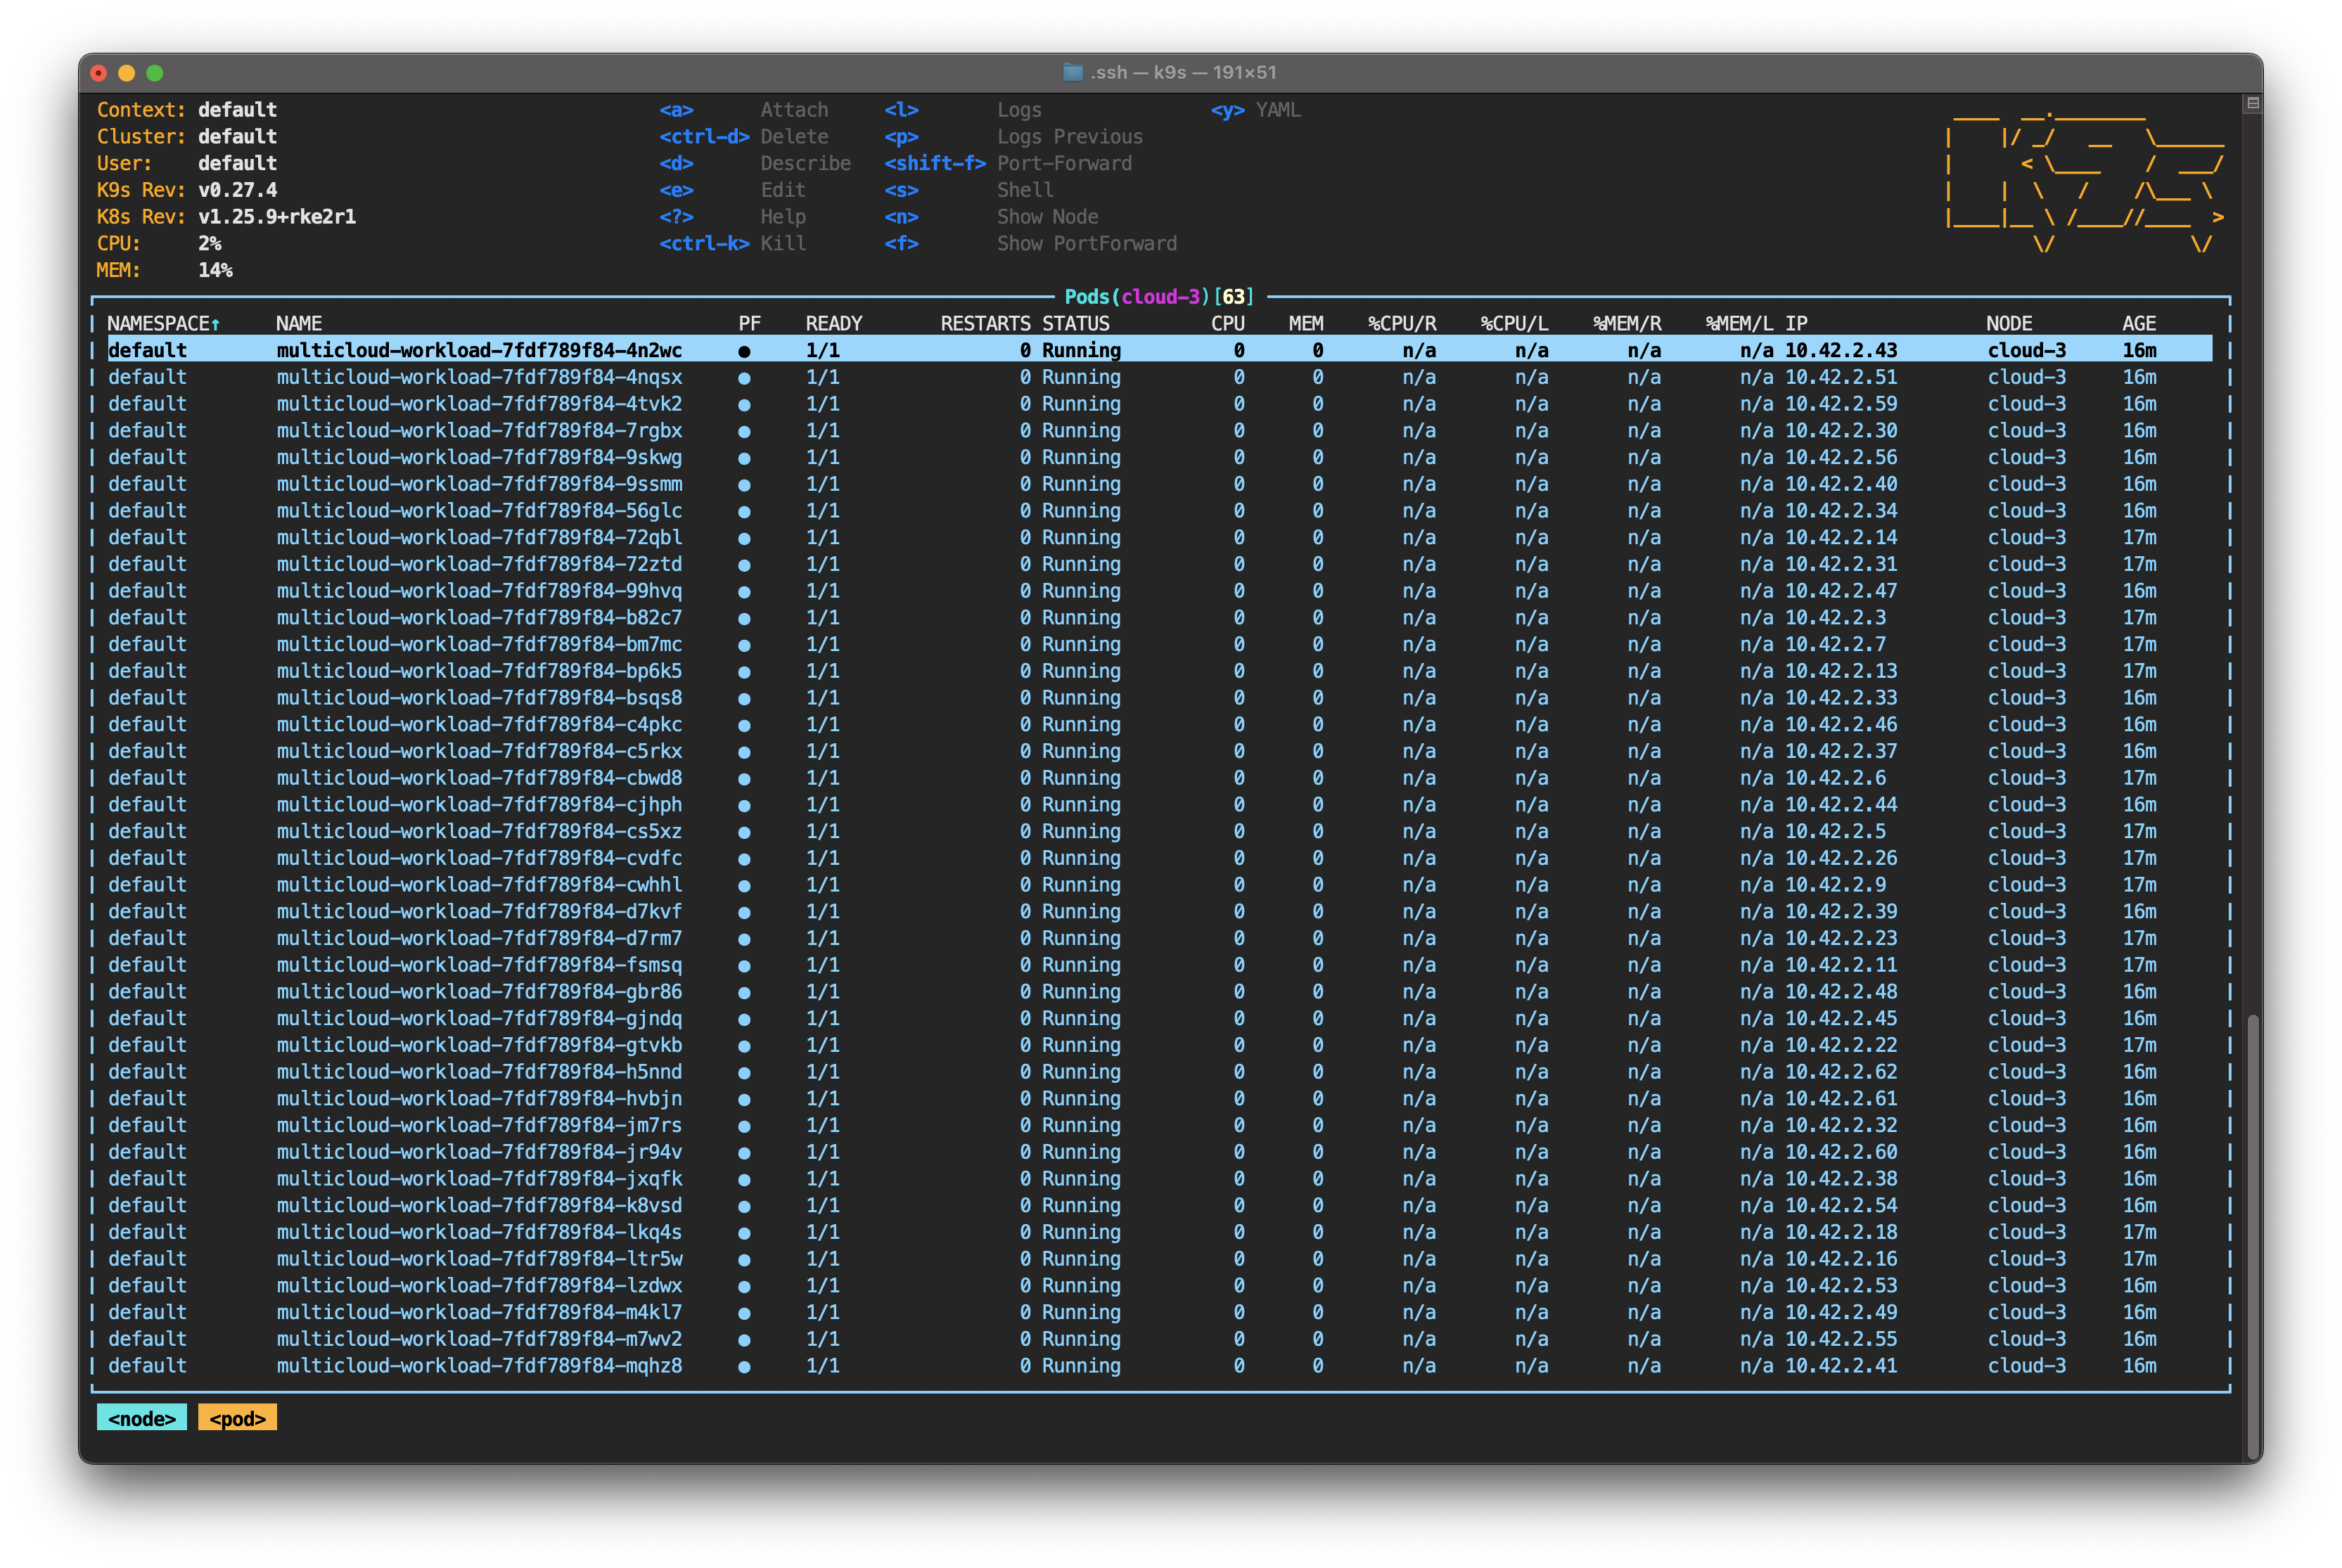
This is expected behavior. By default, the Admission Controller DefaultTolerationSeconds forces the control plane to wait 300 seconds before evicting and rescheduling the missing pods. The idea is to give the node a reasonable amount of time to recover (around five minutes or 300 seconds).
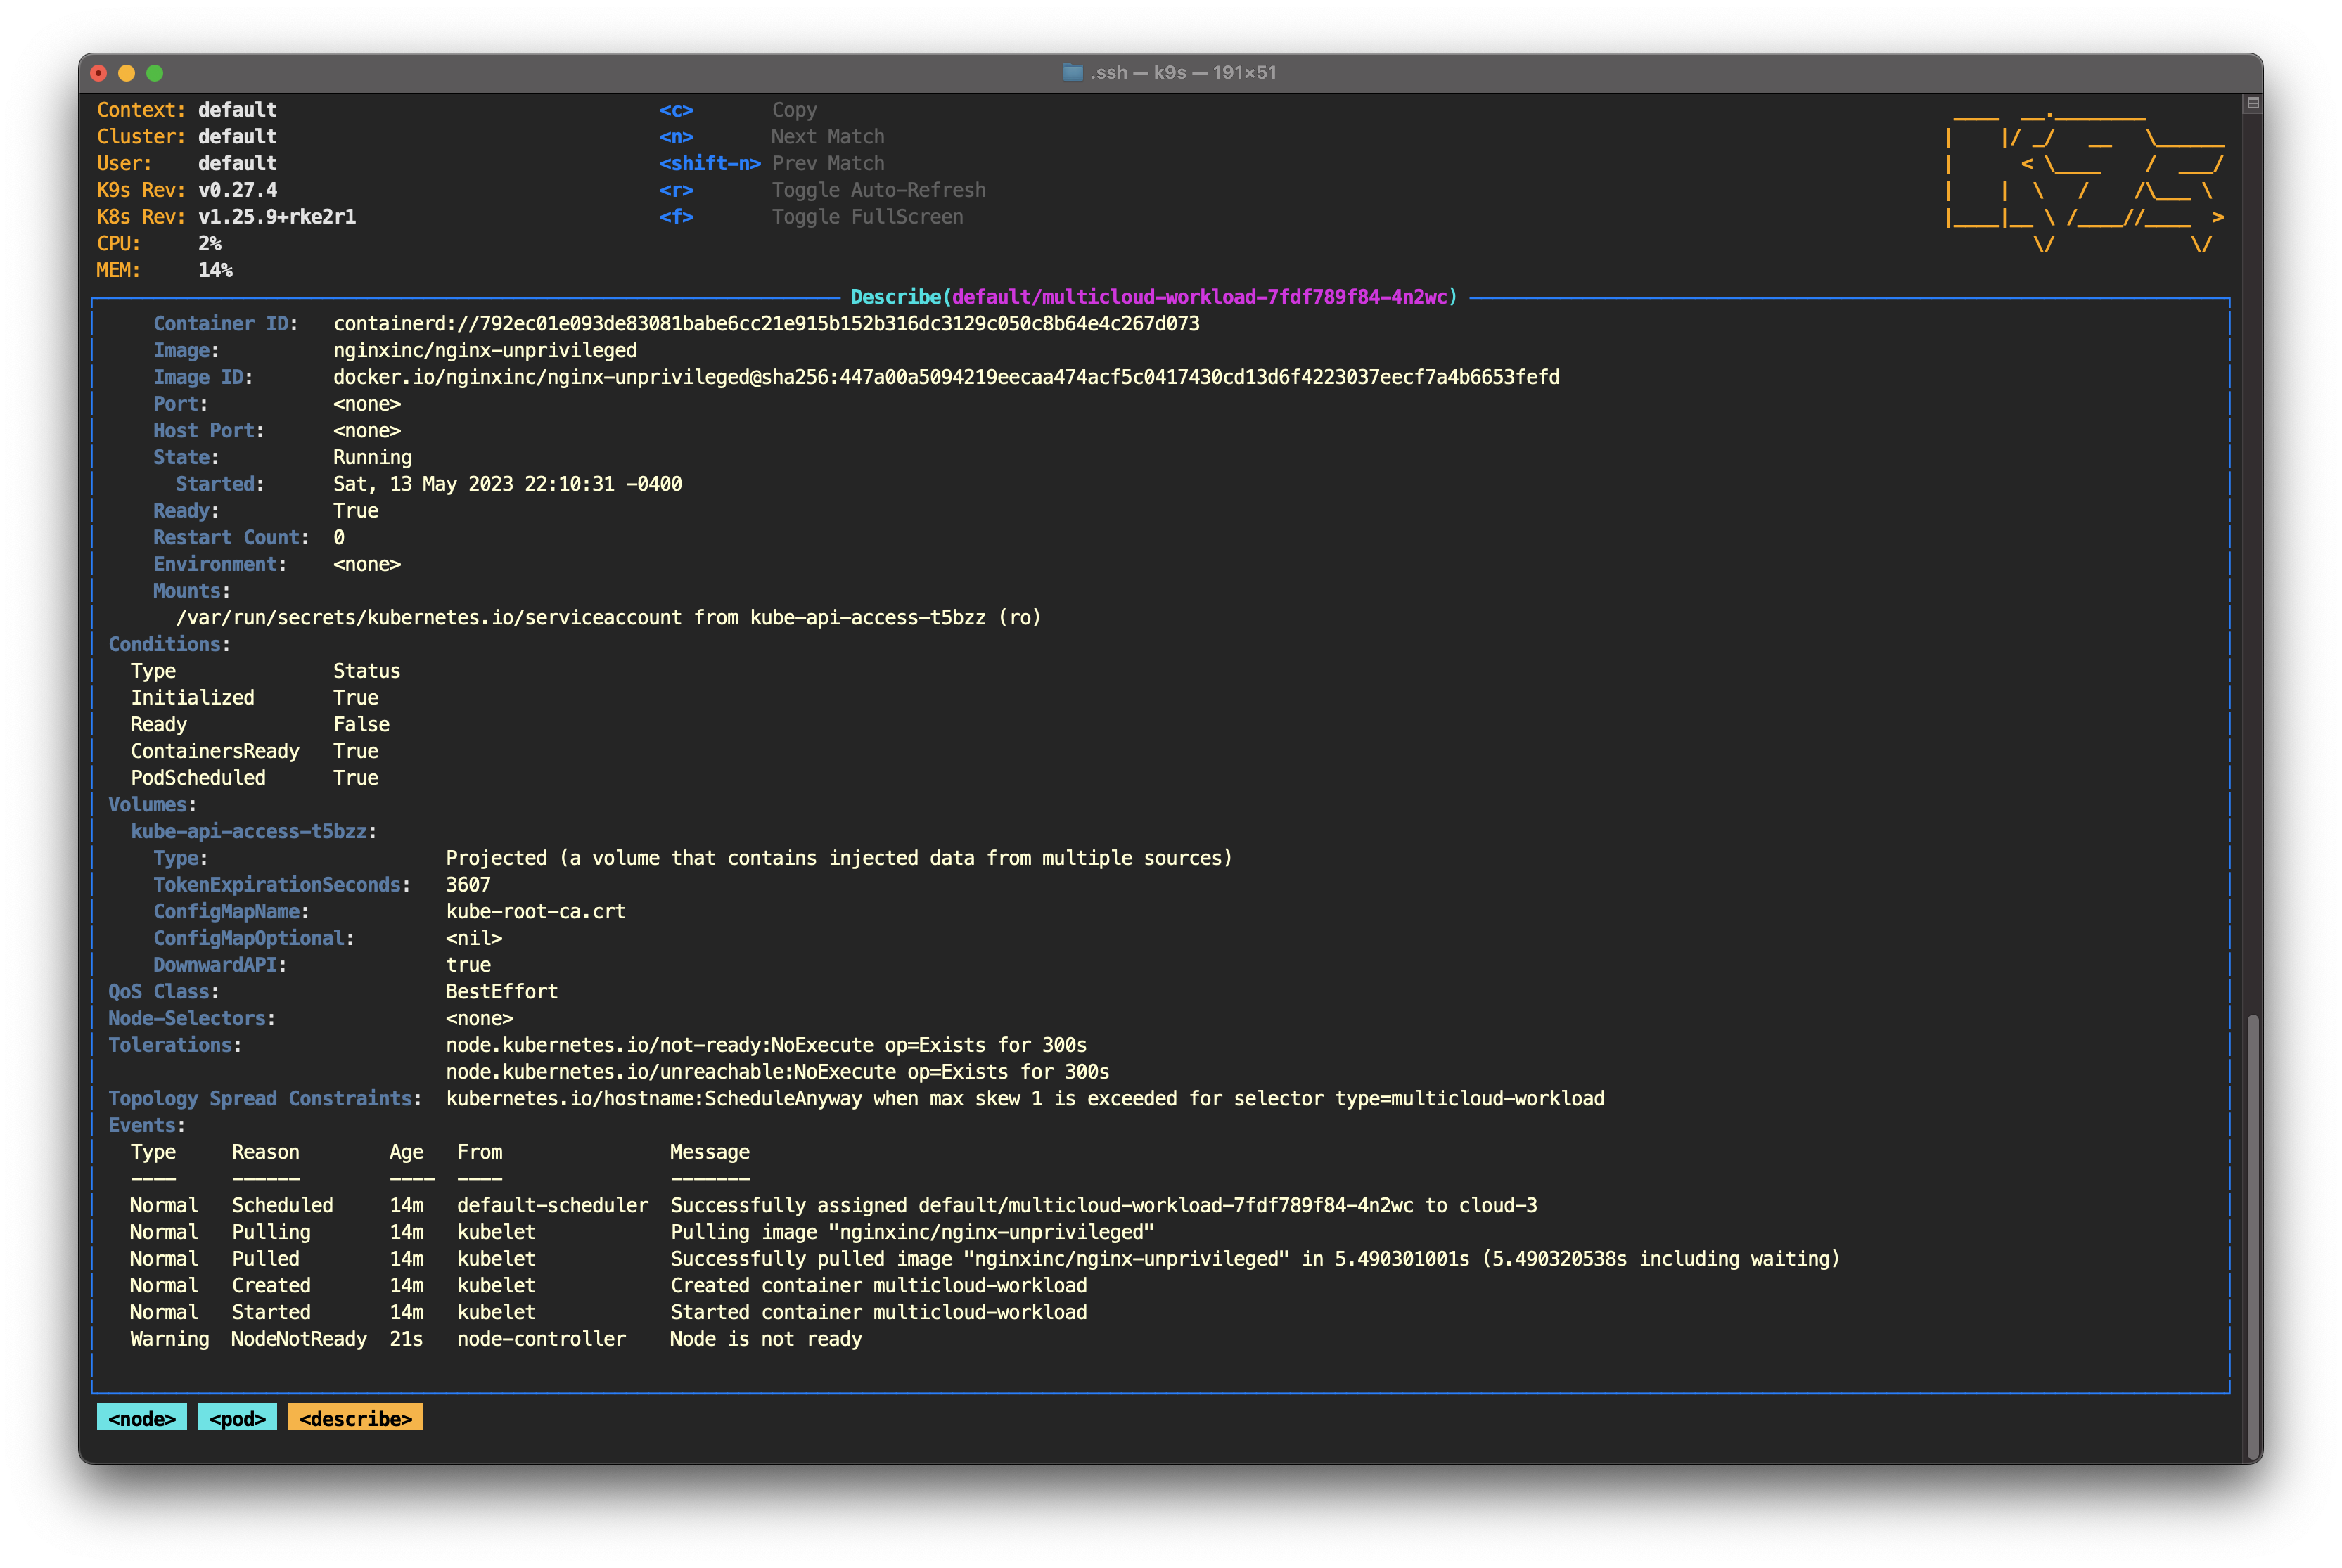
You can confirm all this by selecting any pod and pressing D to describe the pod. Scroll down to the Tolerations section and you'll see node.kubernetes.io/not-ready:NoExecute op=Exists for 300s. In the Events section, you’ll see a warning confirming that the node is not ready.
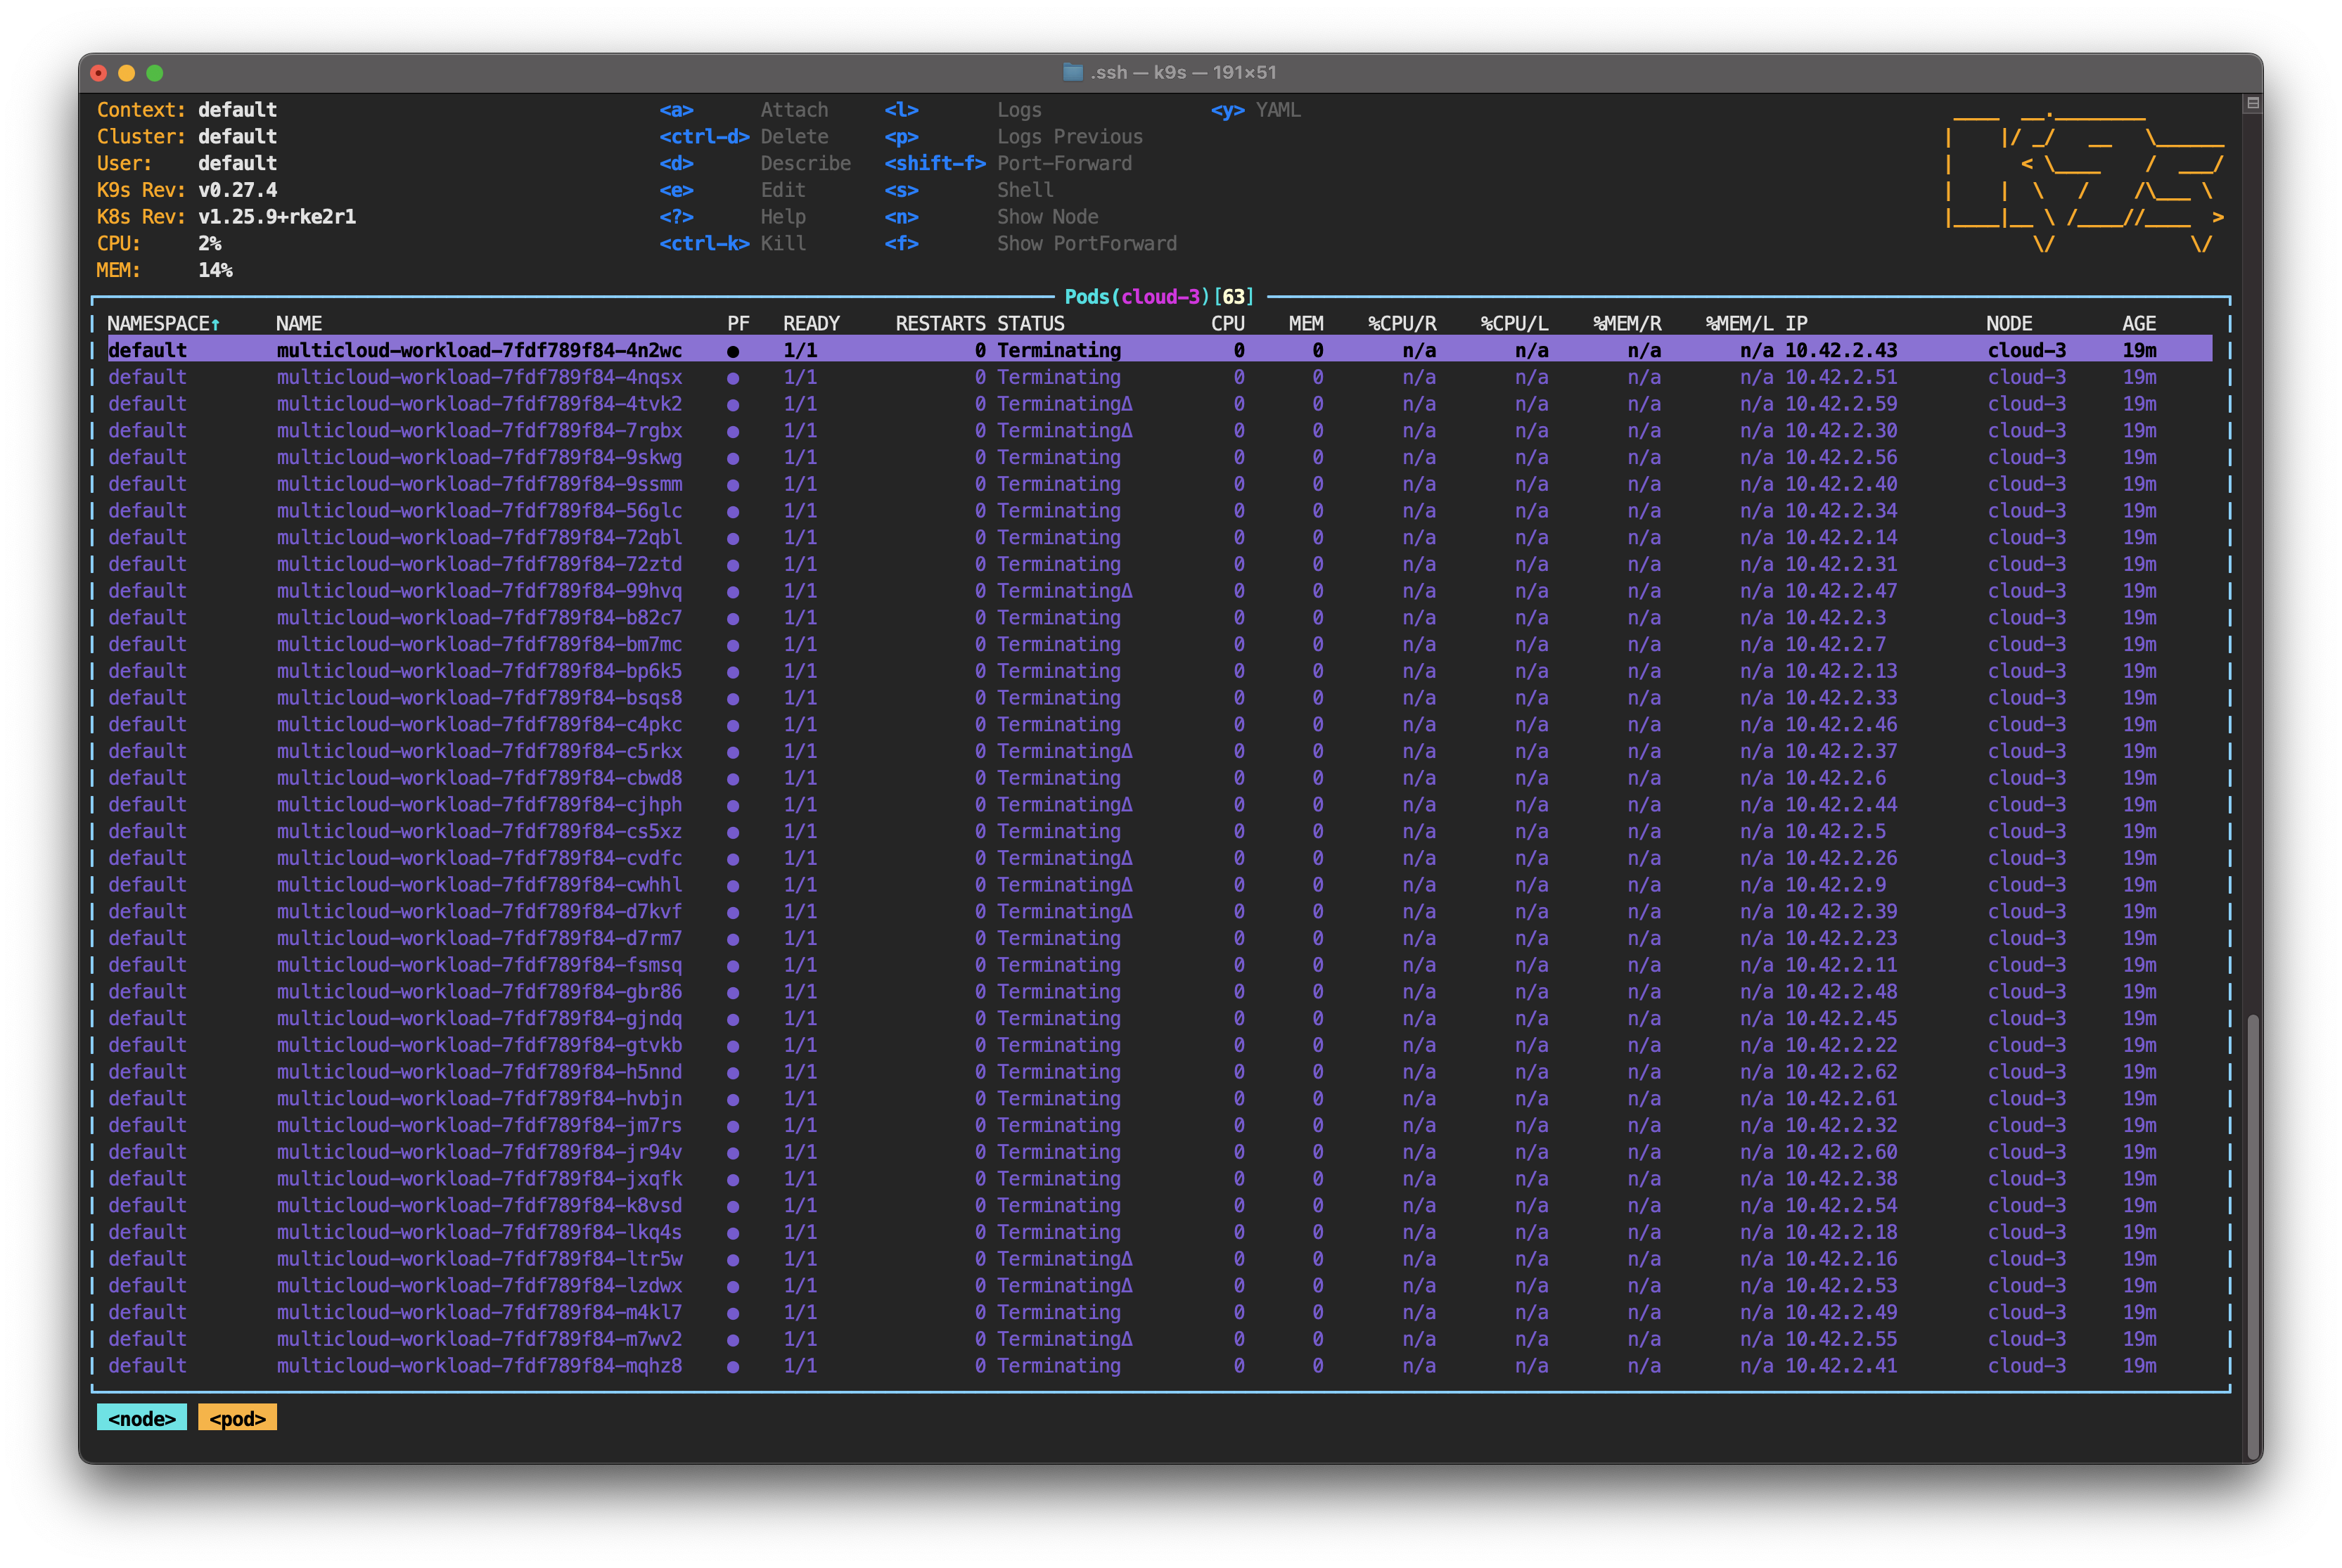
Press Esc to exit this screen. Wait five minutes; you'll see the pod state change to Terminating.
Optionally, you can type : to access the command prompt. Type event and press Enter.
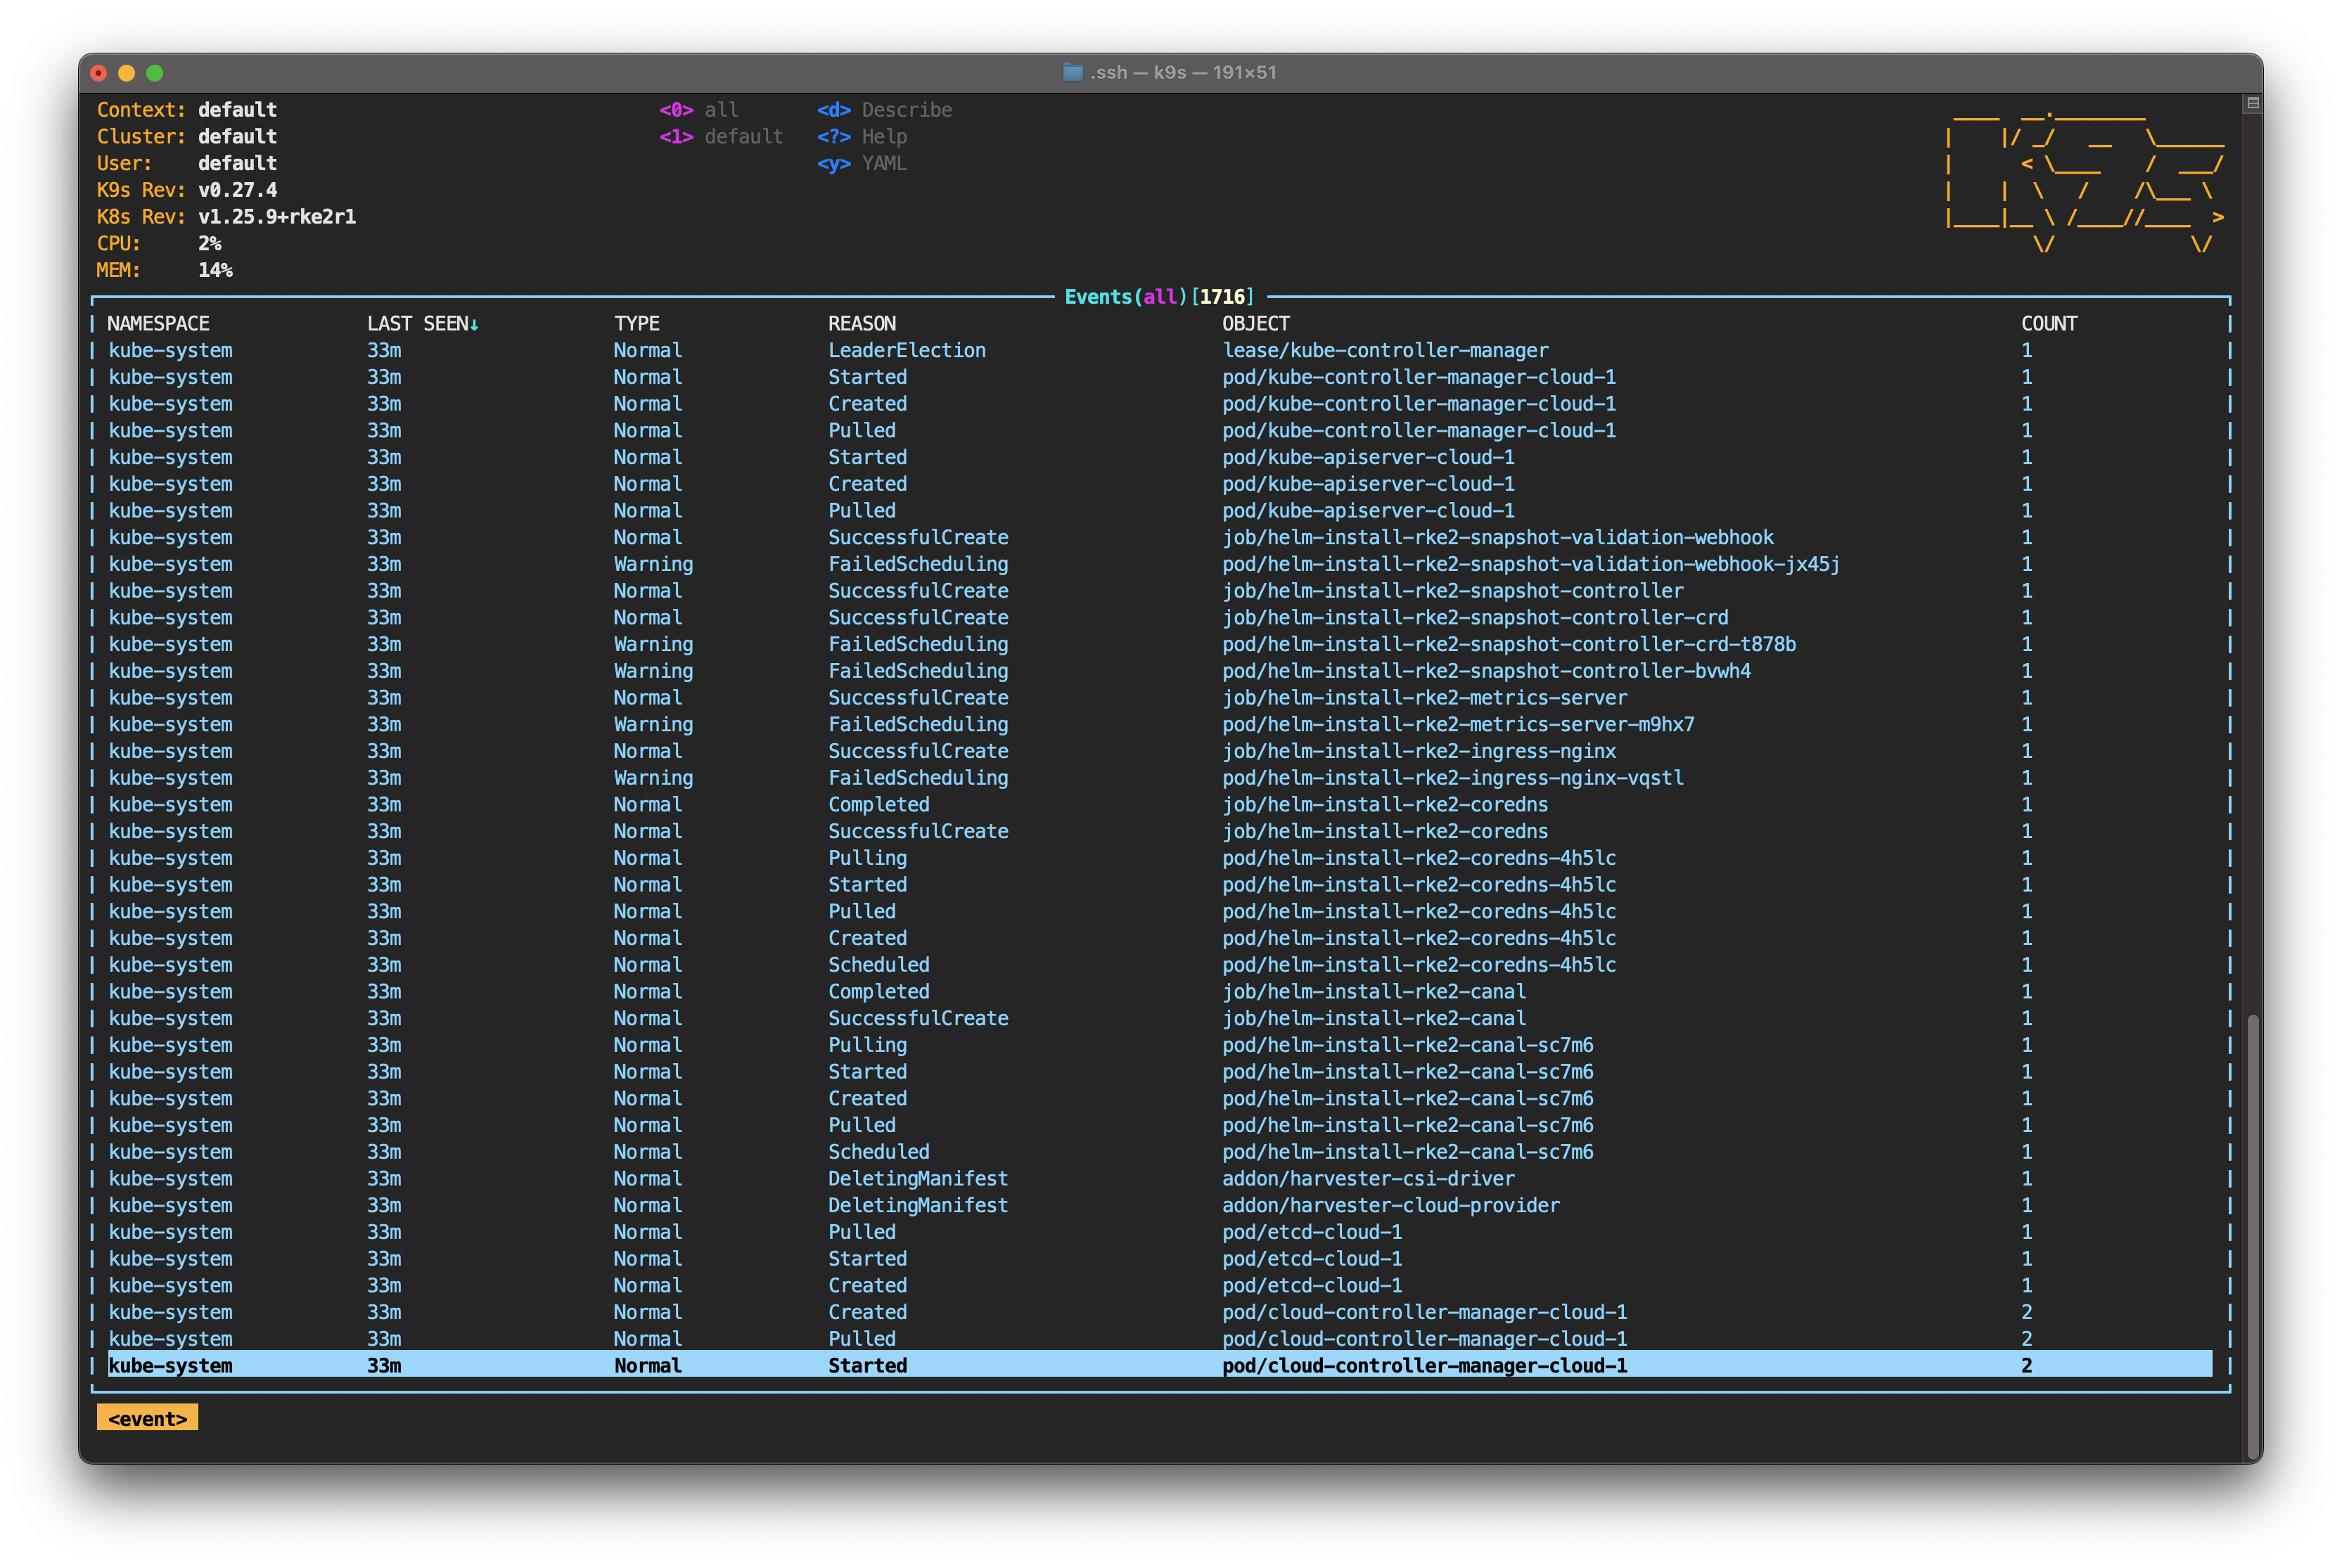
From this screen, you can follow the events that occur in the cluster, including the creation of new pods. Return to the nodes screen by typing : and node again.
As you can see, the new pods have been created to meet the 200 replicas specified in the deployment. In terms of resilience, multi-cloud architecture has lived up to expectations. A cloud provider has suffered an outage, and the load has been distributed among the remaining nodes.
However, failover is only half the story. Let’s analyze what happens when the node comes back online.
Analyzing the Recovery Process
Go to the dashboard of the corresponding cloud provider and power on cloud-3. Wait a few seconds and you’ll see the node status change again.
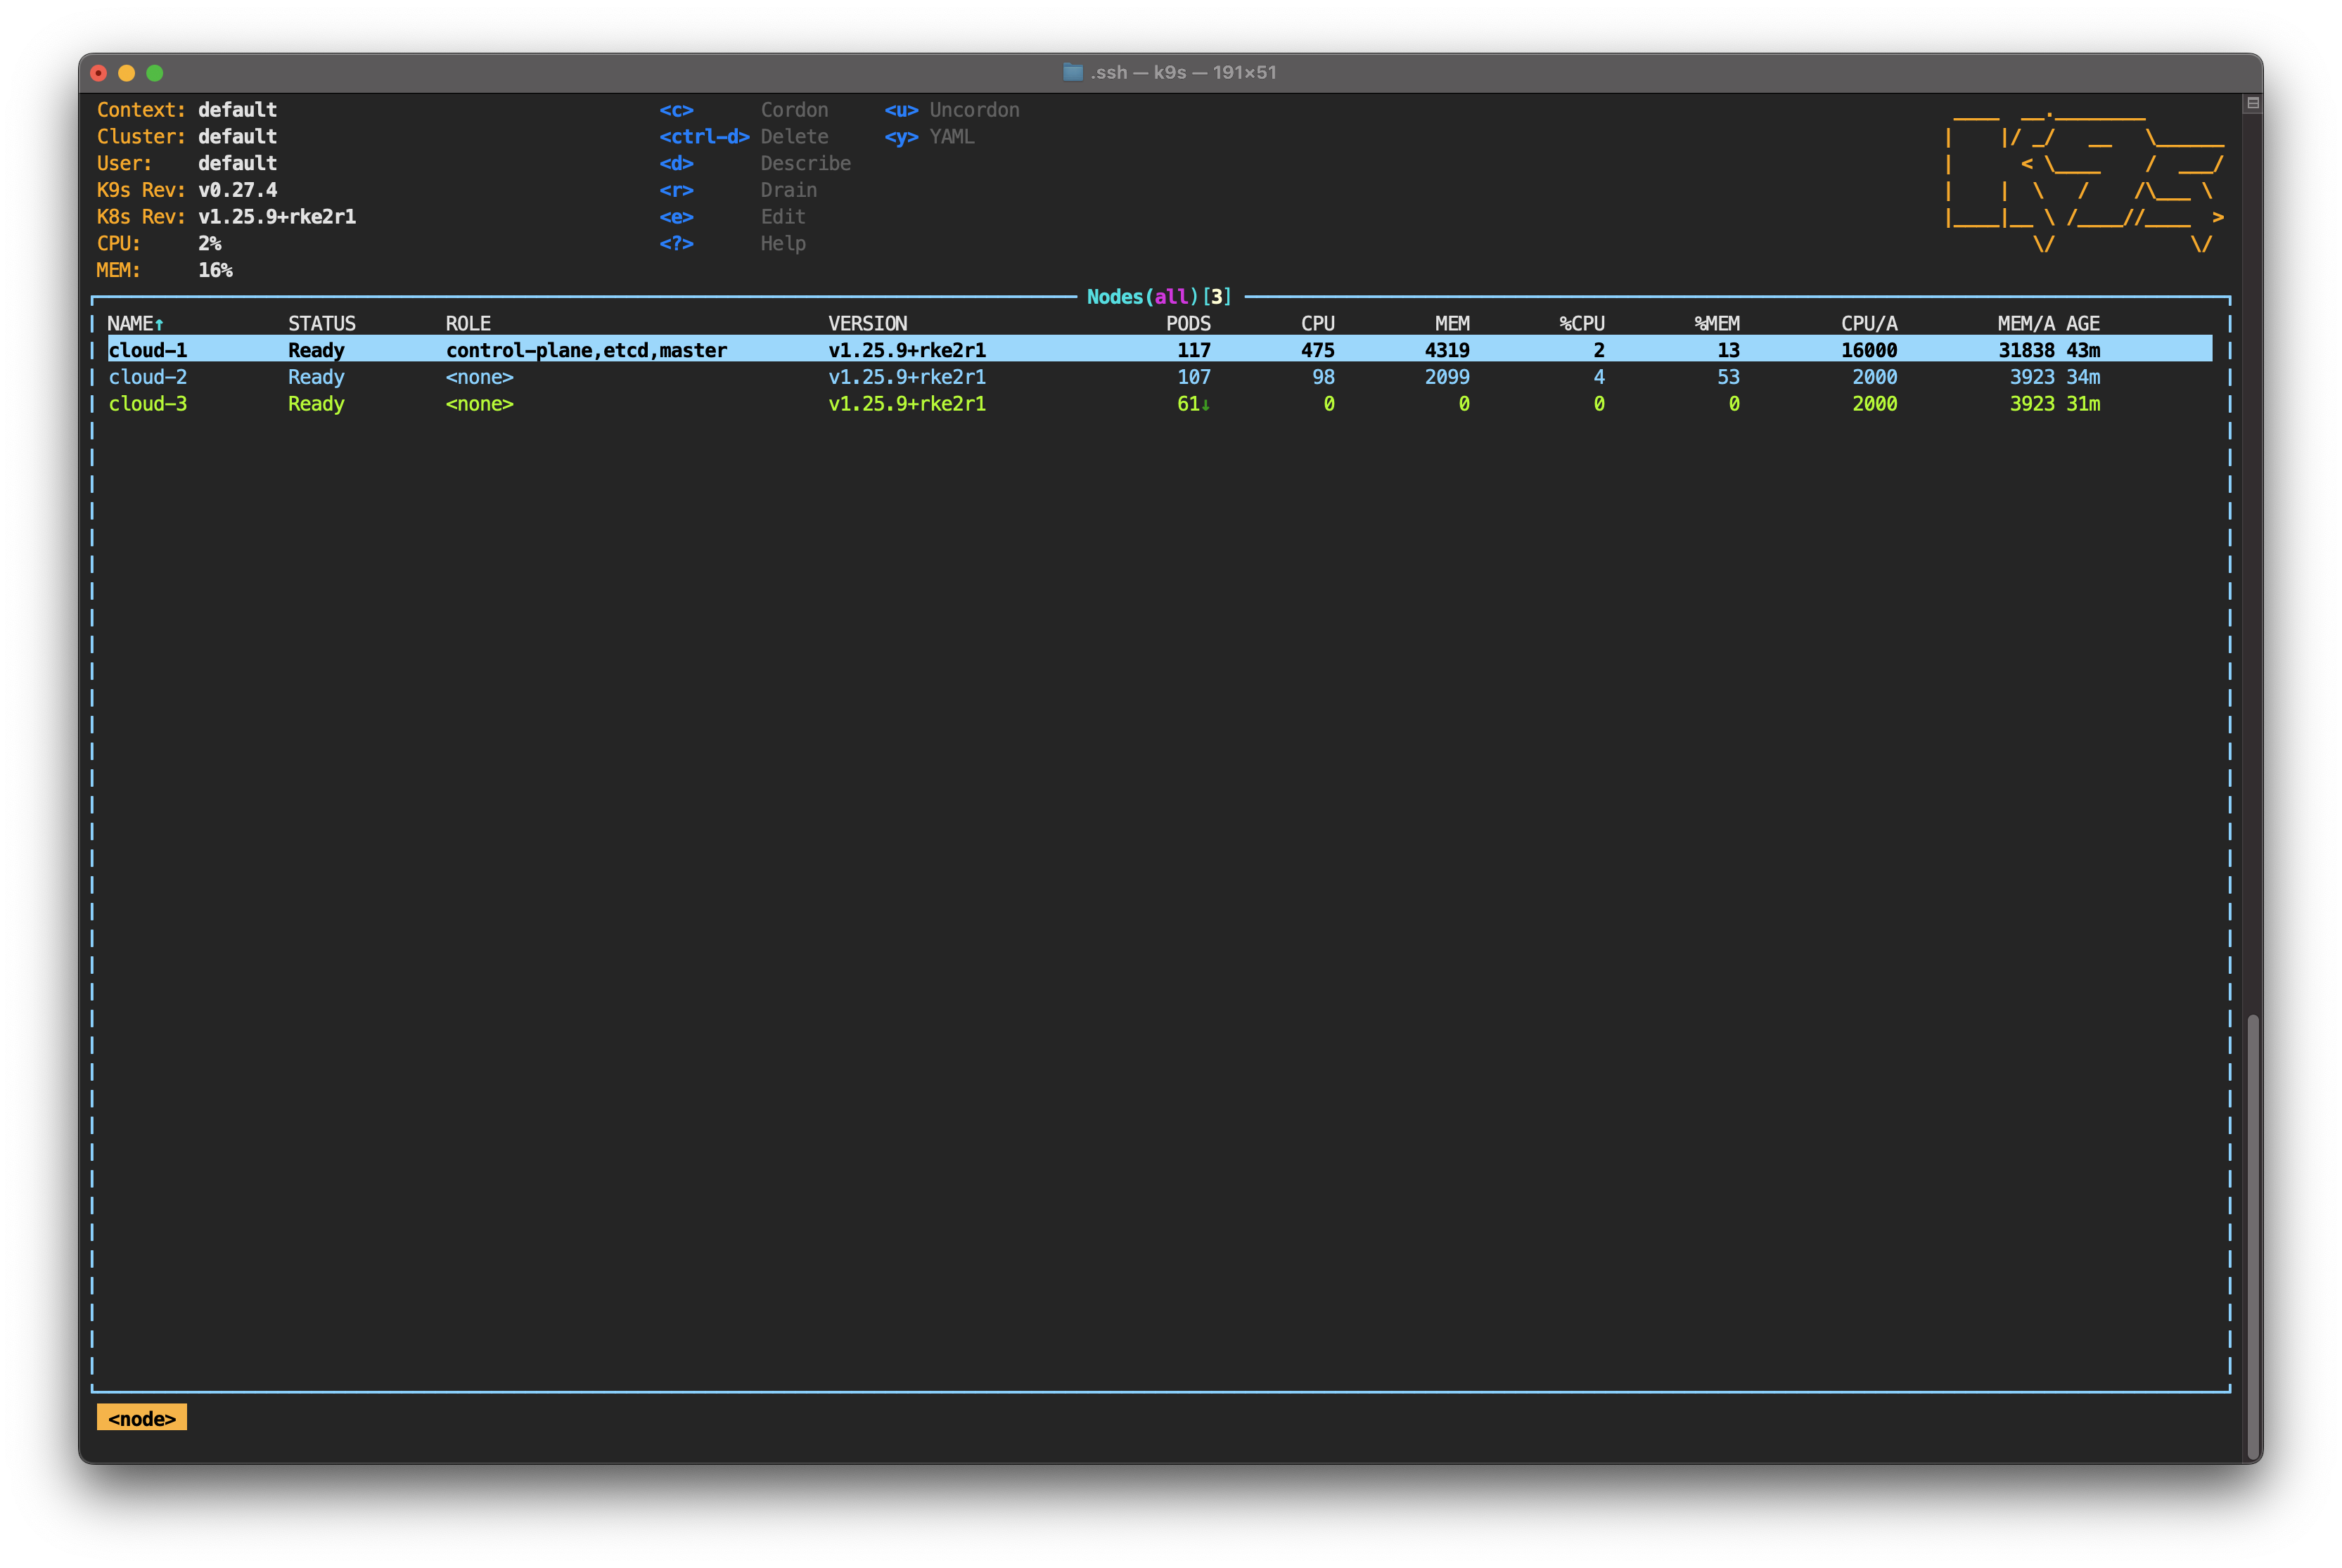
You'll also notice how new pods are being created. However, the pod distribution is far from what it was before the outage.

The cluster recovery process is complete. All the replicas are running, and the operation of the nodes has returned to normal. However, the load distribution across cloud providers is not optimal.
This is expected behavior, even if you use topology spread constraints in your pod definition. From the perspective of the kube-scheduler process, the maximum number of pods per node has not been exceeded, so there is no reason to populate cloud-3.
Maintaining an optimal utilization level across nodes and cloud providers is one of the challenges I brought up in the introduction. It’s not a challenge exclusive to multi-cloud topology, but to Kubernetes management in general.
So, what emerges from analyzing the recovery process is that it follows the steps of the failover process but in reverse. As soon as cloud-3 is active again, the communication between its kubelet and the control plane is re-established. This causes the kube-scheduler to kick in and schedule new pods to cloud-3.
Final Thoughts
Overall, multi-cloud architecture brings an extra level of resiliency to your cluster. This gives organizations greater flexibility and scalability in the face of unexpected events.
With this tutorial, you’ve verified those claims. You deployed an RKE2 cluster using nodes hosted in different cloud providers and then simulated an outage on one of them, observing the workloads being automatically distributed across the remaining providers.
We’ve only covered the tip of the iceberg on this topic, though. You might want to check out some of these other resources that cover multi-cloud Kubernetes multi-cloud:
* Best practices for a multi-cloud Kubernetes strategy
* A Multi-cloud and Multi-cluster Architecture with Kubernetes

Ready to kick the tires?
Use code DEPLOYNOW for $300 credit